Français (France)
 Deutsch (DACH)
 Italiano (Italia)
 Dutch (Nederlands)
 English (United States)
 English (Canada)
 French (Canada)

bfinance insight from:

Xavier Blaiteau
Director, Fixed Income
AI is turning large technology companies back into significant borrowers – we ask what record hyperscaler issuance means for investment-grade benchmarks, and where it matters for investors.
For more than a decade the largest technology groups funded themselves from free cash flow; the AI infrastructure build-out has changed that. Goldman Sachs counts $194 billion of hyperscaler debt issuance by early August 2026, against $108 billion for the whole of 2025, and expects roughly a third of this year's capital expenditure (capex) to be debt-financed. Capex itself is heading towards $1 trillion in 2027.
The signal for investors is real but for those mandates built around broad benchmarks, smaller than the narrative. While the five hyperscalers – which we classify as Alphabet, Amazon, Meta, Microsoft and Oracle – have nearly doubled their weight in the Bloomberg US Corporate Index since the end of 2024, to 4.85%, banks still dominate. The issuance does, however, potentially have significance for investors in three places.
Long duration and higher-rated segments as well as single names – three key areas
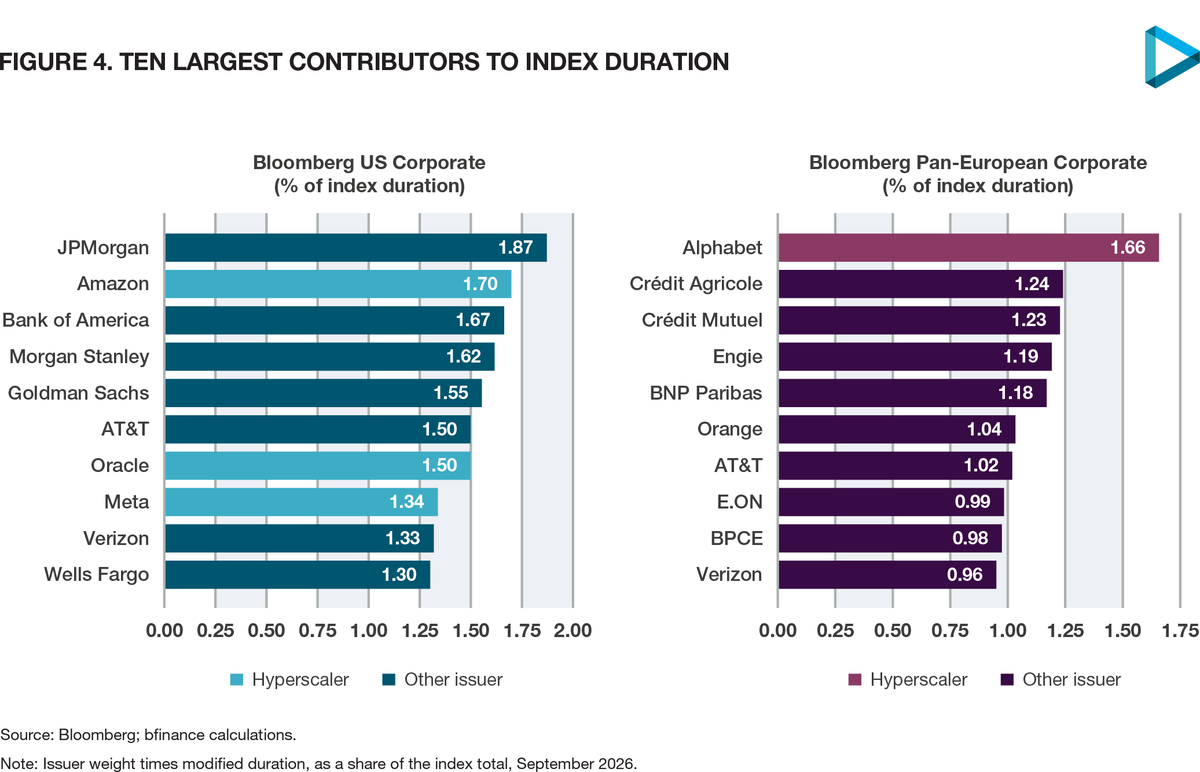
Firstly at the long end, where Amazon has risen from 20th to 2nd among contributors to the US index's duration, and Alphabet is now the largest contributor in Europe. So, for those benchmarked to long-duration credit, including UK pension schemes with buy-and-maintain or LDI-related credit portfolios, hyperscaler concentration is materially higher than the broad index figures suggest.
Secondly, the higher-rated segment, where hyperscalers account for most of the growth in AA-rated debt - as a result of this growth, mandates restricted to higher-rated credit do carry far more hyperscaler exposure than those built around the broad benchmark.
And thirdly the issuance is significant when it comes to managing credit risk related to single names, as underlined by Oracle's downgrade to BBB-. For certain mandates, there is now a stronger case for moving from a standard market-value-weighted benchmark to a capped one. In these instances, while an issuer cap set above current weights would not bind today, it would limit exposure were one borrower's weight and leverage to rise together, as have Oracle's making it main credit risk in the higher-rated group.
For most investors, however, record hyperscaler borrowing argues for closer monitoring rather than a change of benchmark – for the majority of mandates, a standard 1% issuer cap would currently bind mainly on banks, not on AI exposure.
AI issuance: meaningful for some investors rather than transformational for all
It is difficult to dispute that AI is driving meaningful bond issuance. Beyond the hyperscalers themselves, Goldman Sachs tracked close to $500bn of AI-related debt issuance by late July, including data centre finance and high yield, with hyperscalers about 40% of the total. Morgan Stanley, on its own definition, forecast in June that 2026 issuance would approach $570bn. AI-related borrowers have supplied about 18% of US investment-grade issuance this year, against 1% in 2024. Equity is back in the mix too: Alphabet launched an $84.75bn equity programme in June, $44.75bn of it for general corporate purposes including AI capex.
The borrowing is also global. Hyperscalers have issued in euros, sterling, Swiss francs, yen and Canadian and Australian dollars, setting size records in most of these markets. Amazon's €14.5bn deal in March was the largest euro corporate bond on record, Alphabet's £5.5bn sterling deal in February included a 100-year tranche, and Meta, so far a dollar-only issuer, is expected to debut in euros this autumn. Hyperscalers now account for just under 10% of gross euro issuance by non-financial corporates. Underwriters see room for more in euros, but the smaller Swiss franc, sterling and Canadian dollar markets might approach their limits soon.
This claim that AI is transforming bond indices deserves more scrutiny. Most commentary is conditional: concentration risk "may rise", passive investors "could face challenges". The evidence suggests the change is still modest across broad benchmarks, but already significant in specific segments.
We use Bloomberg indices throughout and flag the two places where ICE data are used. ICE's US Corporate Index is broader, with more 144A bonds and more issues (11,755 against 8,909 for Bloomberg), so its issuer weights are a little lower: Amazon is 1.39% of the Bloomberg index but 1.10% of ICE's.
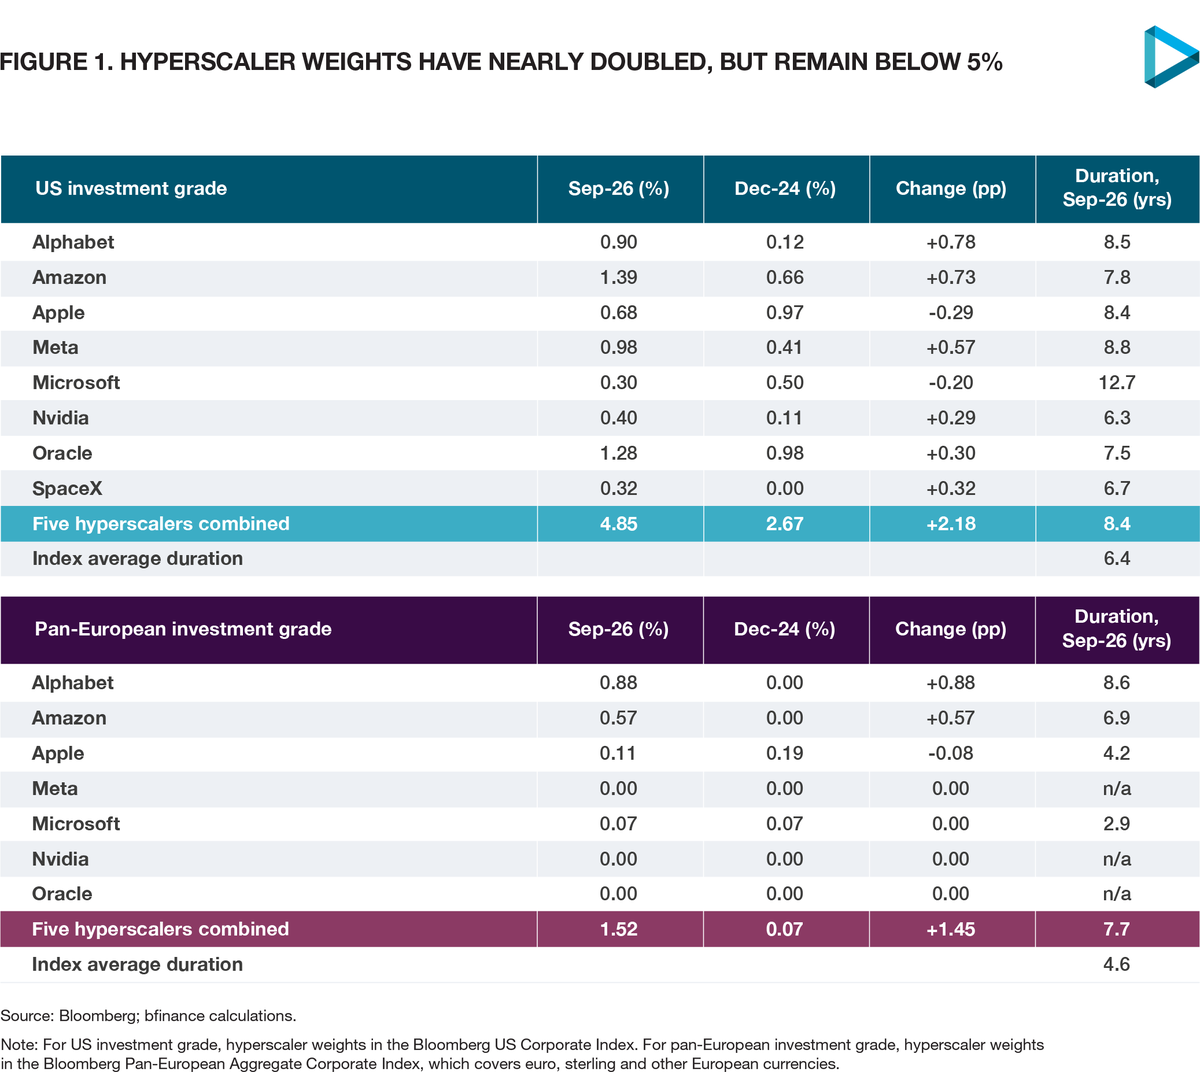
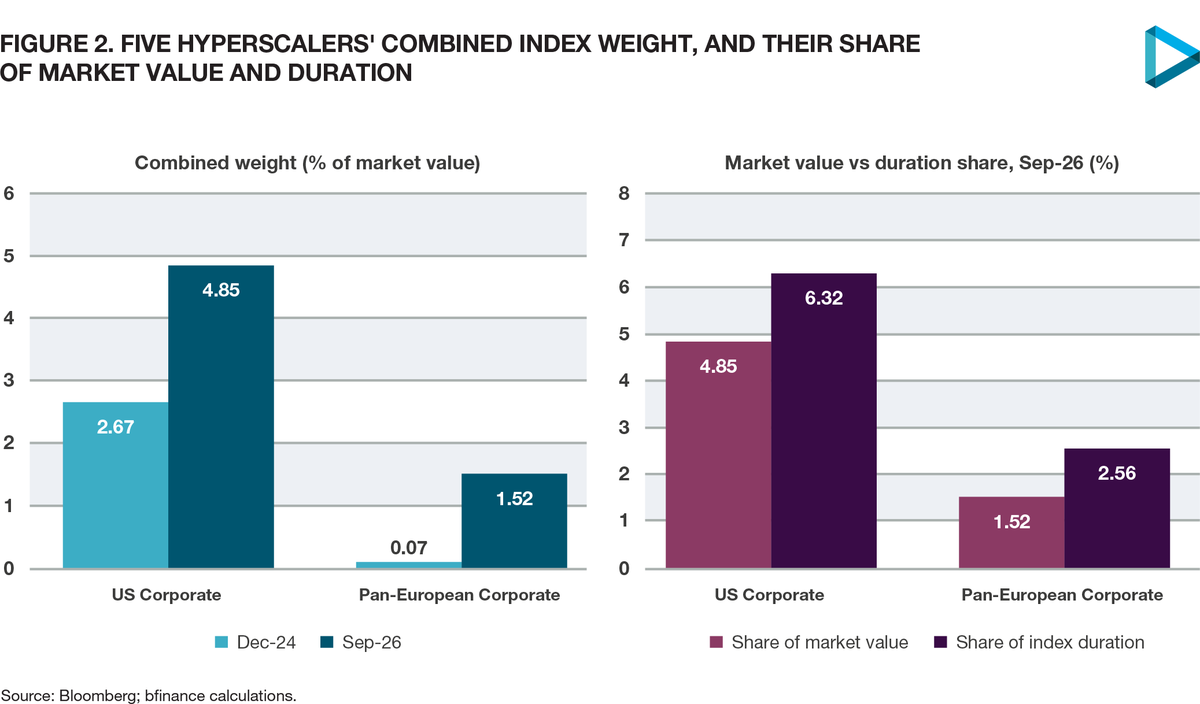
No single hyperscaler exceeds 1.5% of the US index. Amazon is the largest at 1.39%, and Amazon and Oracle are now the seventh and eighth largest issuers, behind six banks. Combined, the five have risen from 2.67% of the index at the end of 2024 to 4.85%, and J.P. Morgan Asset Management estimates their weight could approach 10% by 2030. Goldman Sachs offers a useful yardstick: none of the three largest US bank issuers exceeds 2.3% of the Bloomberg index, and bringing the hyperscalers up to that level would absorb around $510 billion of additional debt.
Weights do not only move one way. Indices are weighted by market value, so issuers that borrow less than the market lose weight: Apple fell from 0.97% to 0.68% of the US index, and Microsoft, which has so far relied much less on the bond market than its peers, from 0.50% to 0.30%.
In Europe the change is sharper: from 0.07% to 1.52%, almost entirely through Alphabet and Amazon, and Alphabet now ranks among the 10 largest issuers in the Pan-European index. The European Central Bank (ECB) notes that hyperscalers account for close to 10% of new euro non-financial issuance, against around 1% of outstanding bonds, so weights will keep rising if issuance continues at this pace. It has flagged a possible crowding-out effect, and Barclays analysis cited in the financial press points to early signs of it in long-dated, higher-rated bonds, where hyperscaler supply is heaviest.
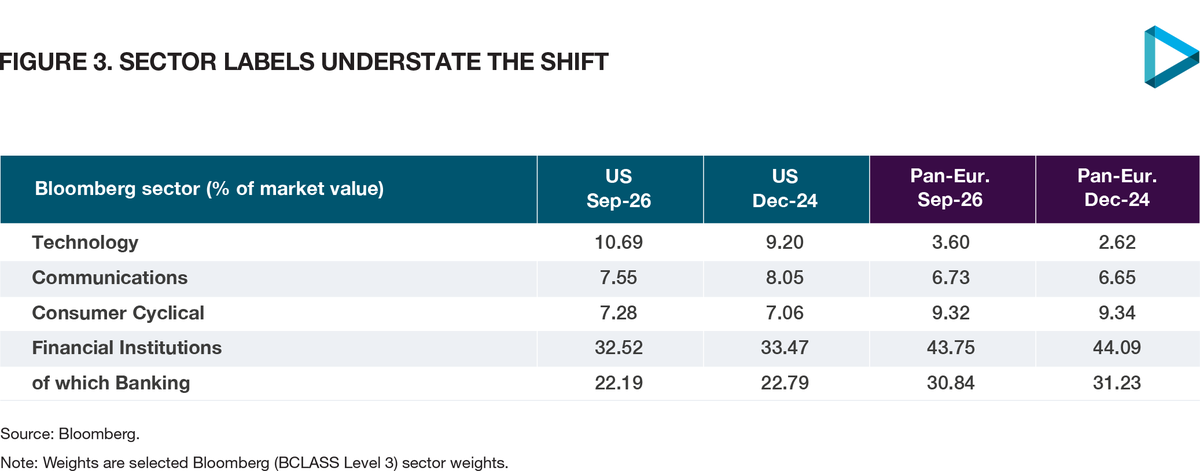
Technology's share has risen from 9.2% to 10.7% of the US index since the end of 2024, and from 2.6% to 3.6% of the pan-European index. Financial institutions still dominate both, at 32.5% of the US index (banking 22.2%) and 43.8% of the pan-European index (banking 30.8%), and the six largest US issuers are all banks. The technology line also understates AI exposure. In Bloomberg's classification, Alphabet, Microsoft and Oracle sit in technology, but Amazon sits in consumer cyclical and Meta in communications, so almost half of the hyperscalers' 4.85% weight lies outside the technology sector. ICE also classifies Amazon as a retailer. Issuer-level data are therefore the better guide.
The concentration is greatest at the long end
Hyperscalers borrow long. Goldman Sachs estimates that AI-related issuers accounted for about 40% of US investment-grade issuance beyond 15 years in 2026. Our analysis of Bloomberg data shows the effect on benchmarks. The five hyperscalers have an average duration of 8.4 years against 6.4 for the US index, so they are 4.9% of its market value but 6.3% of its interest rate risk, up from 3.6% at the end of 2024. Amazon has risen from 20th to 2nd among contributors to the index's duration, behind only JPMorgan, and Meta from 31st to 8th. In Europe the gap is wider, at 1.52% of market value but 2.6% of duration, and Alphabet, around the tenth-largest issuer by market value, is now the largest single contributor to the pan-European index's duration.
Long-dated euro credit is a thin market: on ICE data, bonds maturing beyond 20 years make up only 0.6% of the euro corporate index, against 16% in the US, so even modest hyperscaler issuance there is a large share of that segment. Demand at the long end is starting to fade. Goldman Sachs reports that the number of insurers placing large orders in 30-year AI deals roughly halved between the first and second quarters, and that new-issue concessions on large hyperscaler deals widened to as much as 20 basis point (bps). Other borrowers are reportedly shortening maturities and timing deals around hyperscaler supply. While hyperscaler issuance puts upward pressure on yields at the long end of the curve, fiscal deficits and inflation remain the main drivers of higher long-dated government yields.
For investors benchmarked to long-duration credit, including UK pension schemes with buy-and-maintain or LDI-related credit portfolios, hyperscaler concentration is materially higher than the broad index figures suggest. In the Bloomberg Sterling Non-Gilts AA 15+ index, a narrow index of 31 long-dated, high-quality bonds, Alphabet and Amazon now account for a third of market value (25.2% and 7.7%), against nothing at the end of 2024. This is where the benchmark effect is most visible today.
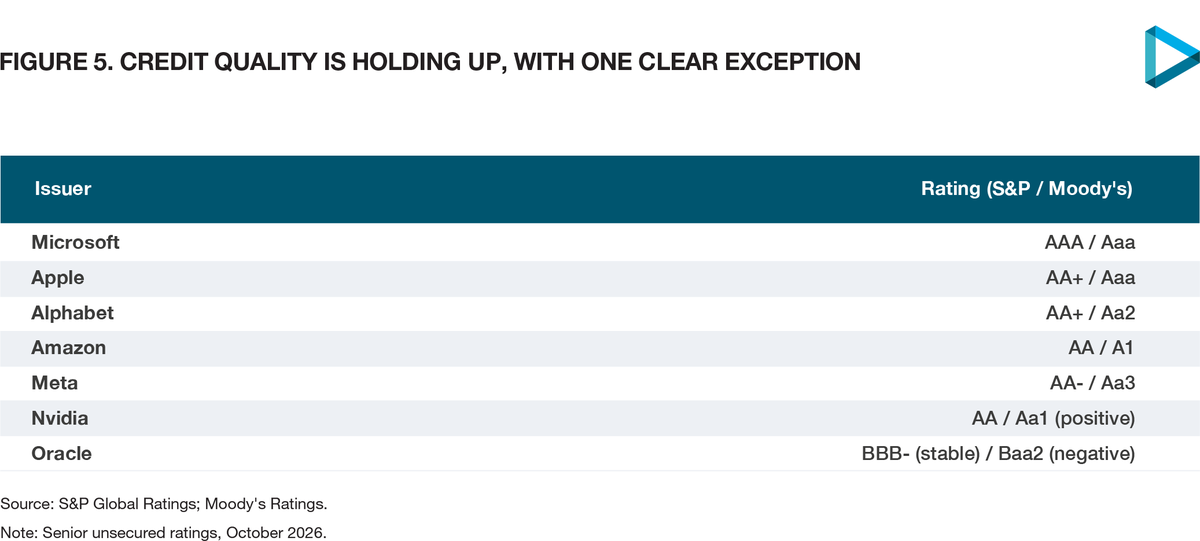
Four of the five hyperscalers are rated AA- or better, and their borrowing is lifting the rating profile of both benchmarks. The share of the US index rated AA or above rose from 8.4% to 10.6% between the end of 2024 and September 2026, and the four AA-rated hyperscalers account for 1.9% of that 2.2% rise. In the pan-European index their contribution exceeds the whole increase: excluding them, the AA-and-above share would have fallen. Over the same period the BBB share fell from 47.7% to 44.3% of the US index and from 49.9% to 48.4% of the pan-European index.
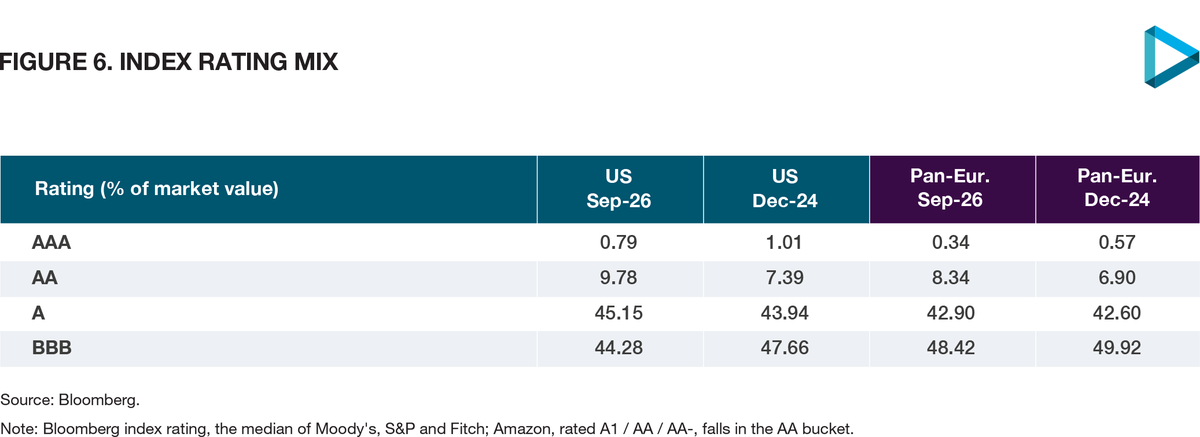
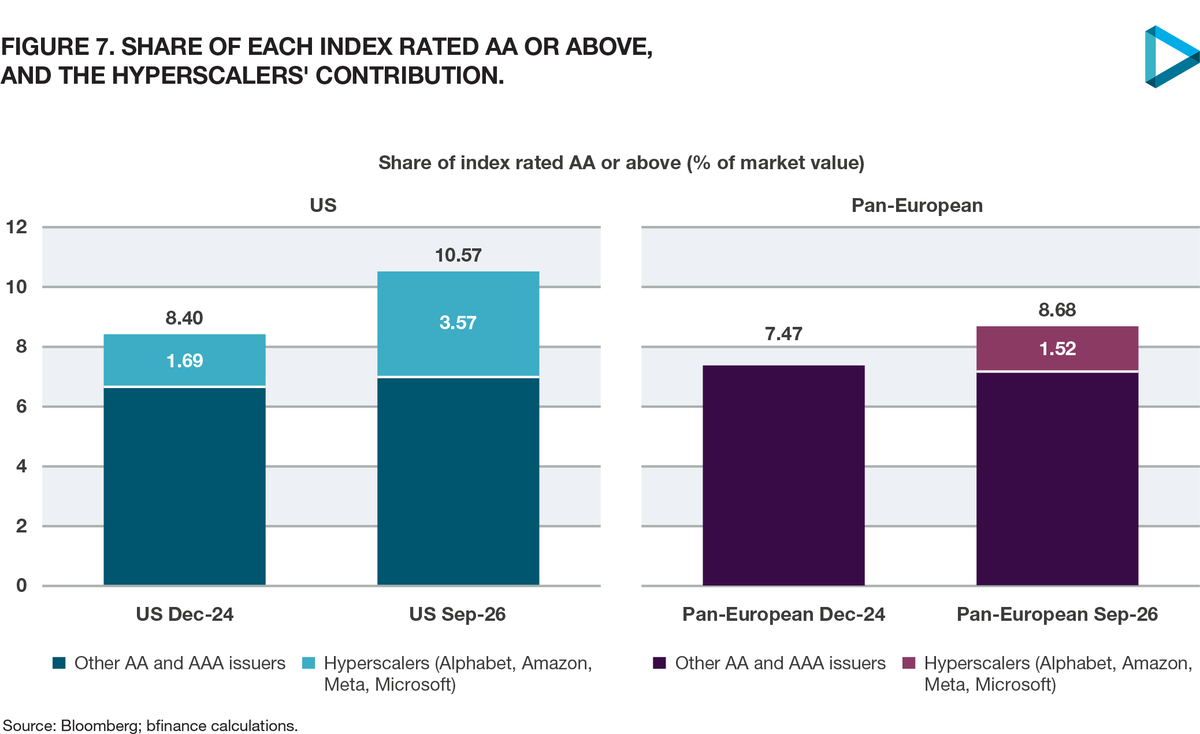
Higher ratings also bring concentration. The four AA-rated hyperscalers make up about a third of the US index's AA-and-above segment (3.57% of a 10.57% share), so mandates restricted to higher-rated credit carry far more hyperscaler exposure than the broad benchmark.
The exception is Oracle. S&P cut its credit rating to BBB-, one notch above high yield, in July 2026, citing heavy AI capex, negative free cash flow and customer concentration; Moody's rates it Baa2 with a negative outlook. Oracle was the largest hyperscaler in the US index at the end of 2024 and remains the second largest. Its 1.28% weight in the $7.3 trillion Bloomberg US Corporate Index implies around $94 billion of index-eligible bonds, about two and a half times the $35.8 billion that left the Bloomberg investment-grade index when Ford became the largest fallen angel to date in 2020. Index eligibility uses a composite of agency ratings, so one further cut would not by itself remove Oracle from investment-grade indices, but the margin has narrowed.
Markets are charging more for AA-rated supply, and hyperscalers are happy to pay up. Since the end of 2024 the average spread on AA-rated bonds in the US index has widened from 45 bps to 60 bps, while A and BBB spreads were broadly unchanged; in Europe, AA spreads were flat while A and BBB spreads tightened by around 10 bps. The extra spread investors earn for moving from AA down to BBB has narrowed by roughly 10 to 15 bps in both markets, consistent with heavy hyperscaler supply in the AA segment. Goldman Sachs's basket of AI-leader bonds has moved from 74 bps to nearly double that over 12 months. A higher average rating therefore does not guarantee that an index will behave like a higher-quality one.
Balance sheets are not the binding constraint. FactSet puts total debt to earnings before interest, tax, depreciation and amortisation (EBITDA) at around 1x or below for Alphabet, Amazon, Meta and Microsoft, and Goldman Sachs estimates that the group could add around $2 trillion of debt before reaching leverage still consistent with investment-grade ratings. The pressure points are cash flow, which FactSet expects to be close to zero or negative in fiscal 2026 for all but Alphabet and Microsoft, off-balance-sheet lease commitments of around $820 billion, and Oracle, whose leverage is already above the 4x level that triggered its downgrade. The debate is therefore mainly about concentration, with credit quality a growing but largely issuer-specific concern.
Passive investing raises concentration, not necessarily credit risk
The passive argument is simple: indices are weighted by the market value of debt outstanding, so issuance raises an issuer's weight and its share of passive indexing flows. The ECB noted in August that this mechanical rebalancing could add pressure on other issuers' spreads; hyperscalers already accounted for 15% of the increase in euro-area holdings of euro corporate bonds in the year to March 2026.
This is a concentration effect, not necessarily a credit one. Index weight reflects debt outstanding, not leverage, so the criticism that indices lend most to the most indebted issuers is not strictly correct. The distinction has limits, however. At the end of 2024 the largest hyperscaler weight belonged to Oracle, which is also the most leveraged and lowest rated of the five: weight and leverage rise together when an issuer’s borrowing grows faster than its earnings.
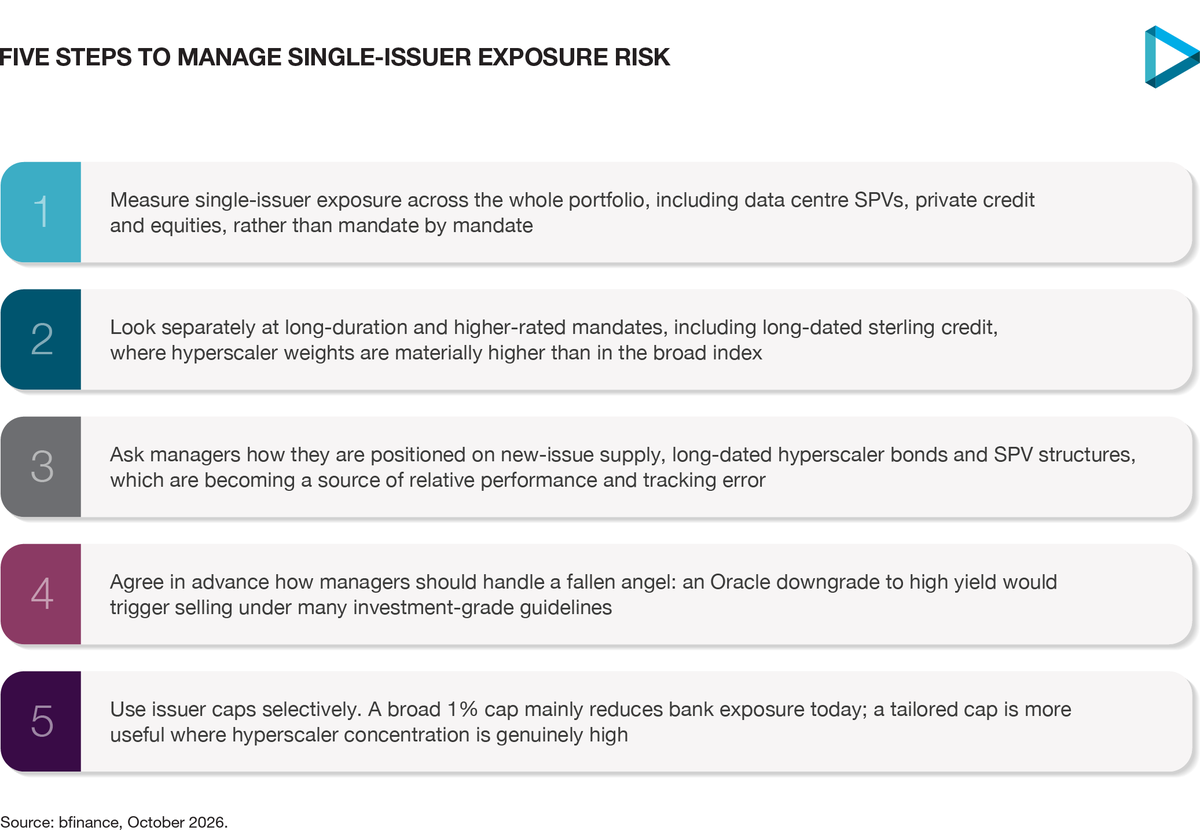
Concentration matters for active managers too. Bankers have pointed to AT&T as a precedent, with investors reported to have reached single-name limits as its debt approached $100 billion; Amazon alone is reported to have issued more than $92 billion equivalent in 2026. Exposure is also harder to measure than index weights suggest, because hyperscaler risk reaches portfolios through data centre special purpose vehicles (SPVs), private credit and equities as well as corporate bonds. Some investors quoted in the press suggest that holders may have drifted above their intended single-issuer limits, and Goldman Sachs notes that clients' existing equity exposure to technology is tempering their appetite for the debt.
A 1% issuer cap would mainly cap banks, not hyperscalers
For broad, all-maturity mandates the case for moving from a standard market-value-weighted benchmark to a capped one remains weak, and ICE's capped index provides a live test (the second place we use ICE data). The ICE BofA US Corporate Constrained Index limits each issuer to 1%. At end-September the cap bound on eight issuers, six US banks plus Amazon and Oracle, and its main effect was to cut banking from 16.8% to 15.5% of the index, while technology & electronics rose slightly. Performance has been almost identical: year-to-date excess returns over Treasuries were 0.44% for the capped index against 0.42% for the standard index, with the same three- and 10-year annualised excess returns.
The case is stronger for long-duration and higher-rated mandates, where hyperscaler weights are already well above their broad-index share, and at issuer level, where a cap set above current weights would not bind today but would limit exposure if one borrower's weight and leverage rose together, as Oracle's have. For most investors the proportionate response is to monitor these exposures against agreed thresholds, across the whole portfolio rather than within the credit benchmark alone.
Conclusion: a financing signal first, a benchmark signal at the margins
So, signal or narrative? The signal is real, but it is first a corporate finance signal. Hyperscalers have become large, recurring borrowers as AI makes technology more capital intensive, and with capex heading towards $1 trillion in 2027 that borrowing will continue. For broad benchmarks, the narrative is ahead of the data: hyperscalers are under 5% of the US index and around 1.5% of the pan-European one, and their high ratings mean issuance has raised technology exposure while improving the average rating mix. Where the narrative is already fact is at the long end, in the higher-rated segment and in single names, Oracle above all.
The main risk to this view is a weaker AI cycle. Apollo's chief economist has argued that the credit case rests on hyperscaler operating cash flow rising substantially, from roughly $600 billion to $2 trillion. If that does not materialise, spreads could widen, capex could be cut and stress among lower-rated AI borrowers could spread to investment grade. These bonds are also increasingly a claim on the same AI cycle that drives equity returns, which weakens the diversification credit is meant to provide.
For now, AI is reshaping the supply of investment-grade credit far more than the structure of broad benchmarks. That argues for active monitoring, particularly in long-duration and higher-rated mandates and at issuer level, rather than for capped or constrained indices, which today would mostly cap banks.
Important Notices
This commentary is for institutional investors classified as Professional Clients as per FCA handbook rules COBS 3.5R. It does not constitute investment research, a financial promotion or a recommendation of any instrument, strategy or provider. The accuracy of information obtained from third parties has not been independently verified. Opinions not guarantees: the findings and opinions expressed herein are the intellectual property of bfinance and are subject to change; they are not intended to convey any guarantees as to the future performance of the investment products, asset classes, or capital markets discussed. The value of investments can go down as well as up.