 English (Global)
  Français (France)
  Deutsch (DACH)
  Italiano (Italia)
  Dutch (Nederlands)
  English (Canada)
  French (Canada)

bfinance insight from:

Xavier Ducros
Senior Advisor, Portfolio Solutions

Duncan Higgs
Managing Director, Portfolio Solutions

Kieren Bussey
Associate, Portfolio Solutions
Transaction cost analysis (TCA) awareness is on the rise, with equity and bond investors increasingly recognising trading as a key area of leakage. Various regulators and associations have sought to improve asset managers’ transaction cost disclosures during recent years, with measures ranging from clauses in MiFID II and PRIIPS to the UK Cost Transparency Initiative and RG97 in Australia. Yet disclosure does not always equal transparency, nor does it necessarily drive good practice; indeed, it can do the opposite.
There is no doubting the significance of transaction costs in long-term results for investors of all sizes. For every $1 billion invested in an active equity portfolio, for example, investors can expect to pay between $1 million and $1.5 million per annum in transaction costs (10-15bps): a combination of visible trading fees and less visible ‘market impact’ (the extent to which the trading activity will move the price of the security contrary to the interests of the trader). The costs may also escalate significantly above that level due to inefficiencies and various other factors that can drive higher expenses or losses. On a consistent basis, and compounded over time, good practice in this area—trading through the right channels using the right processes at the right times—will make a tangible difference to overall value. Moreover, those figures do not take into account the potential additional trading costs involved in managing the currency exposures of these portfolios where that is required for the investor’s strategy (see Tackling Hidden Costs in FX Management).
Figure 1: Average and net simulated five-year monthly asset price paths for a $1 billion equity portfolio (5% annual return, 15% volatility)
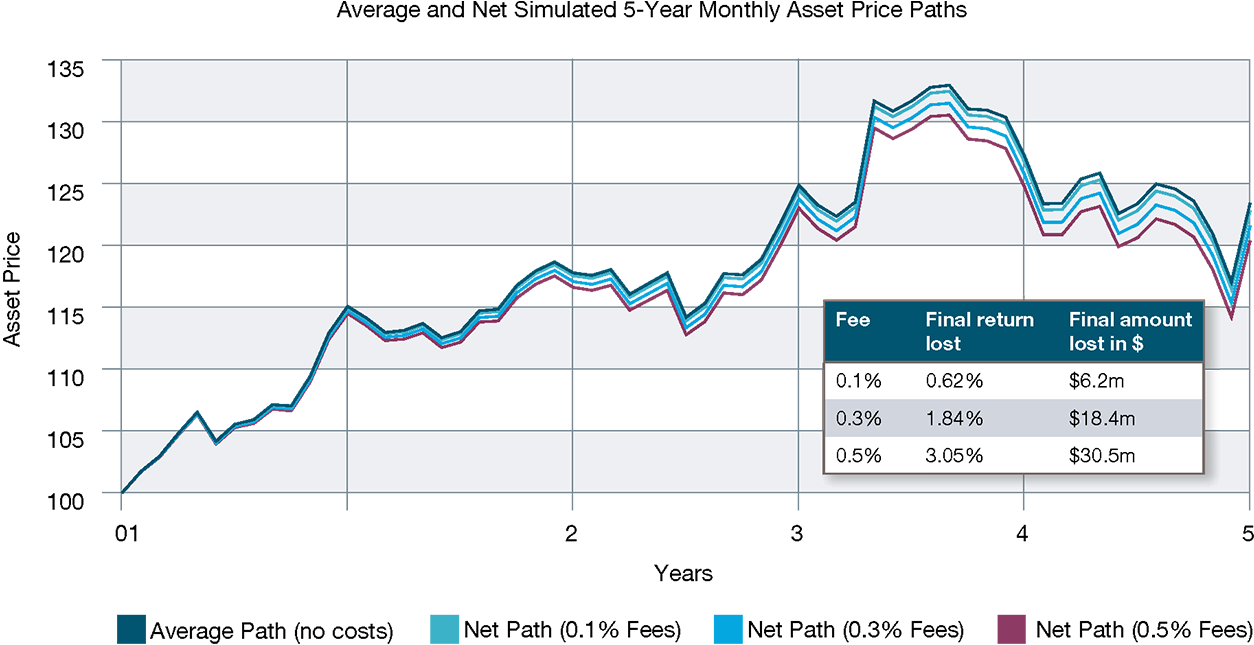
Source: bfinance. Average path is the average result of 100 random simulations for a 5-year period
Historically, transaction-related expenses were typically hidden from the client, buried in overall performance numbers. Transaction cost analysis has become more popular among both institutional investors and asset managers over the past decade, helping to identify areas for improvement and even inform fee negotiations. Unfortunately, however, analysis varies greatly in terms of the degree and granularity of insight offered. Examinations also may or may not be appropriately contextualised: for example, an investor may wish to see simultaneous consideration of subjects such as management fees, investment performance and overall value for money.
Transaction cost analysis (TCA) and regulation
Given the very real financial value of good practice in this space and the historic lack of transparency, it is no surprise that supervisors and bodies of various types have sought to get a handle on the situation. Much of the new regulation, including PRIIPS, is geared towards the retail market and focuses on the disclosure of the total transaction cost—a single number which is intended to convey a combination of explicit cost, implicit cost and ‘dilution adjustment’. Institutional bodies have also been active: in the UK, for example, a pensions-focused cohort (The Pensions & Lifetime Savings Association, the Local Government Pension Scheme Advisory Board and the Investment Association) collaborated in 2018 to launch the Cost Transparency Initiative, which has subsequently released a template for cost reporting.
Jargon buster:
- Explicit transaction costs: A ‘fee’ or visible expense associated with trading including brokerage fees, taxes, exchange and clearing fees.
- Implicit transaction costs: Also known as ‘impact’ or ‘market impact’, the implicit cost reflects the difference between the price at the time a trade was instructed and the price achieved. In equities, this is calculated using the ‘arrival price’: the mid-market price of a security at the time the order is transmitted (the difference between the execution price and the arrival price is known as the ‘arrival cost’). In bonds, this is calculated using ‘half spread’: the difference between the best offer price and the best bid price, divided by two.
- Dilution adjustment: Dilution adjustments in swing pricing involve modifying a mutual fund's net asset value to account for transaction costs associated with significant investor inflows or outflows, thereby safeguarding the interests of existing shareholders. Within the context of PRIIPS, variations emerge between the EU and UK methodologies with regard to the effects of dilution adjustment on the calculation of total transaction costs.
Yet do these initiatives deliver transparency to asset owners on transaction costs and improve practices among asset managers? From the perspective of a sophisticated institutional investor wishing to get clarity on transaction costs, there are several shortcomings in MiFID II and PRIIPS:
- These regulations instruct on the provision of a single final number combining explicit cost, implicit cost and dilution adjustment. This final number is very difficult to analyse or interpret.
- The number is based on a specific measure of price. When assessing implicit cost, it is restrictive to focus solely on the arrival price (or, in the case of bonds, half spread). Investors could also consider, for any given trading day, other benchmarks such as the Volume-Weighted Average Price (VWAP), open-close and high-low for a more comprehensive understanding of market dynamics and execution strategies.
- The methodology for producing the number differs by region. For example, the EU Cost methodology establishes that the aggregated ‘transaction cost’ figure cannot be lower than the ‘explicit cost’ figure, whereas the UK cost methodology merely requires that the aggregated figure cannot be negative (which might otherwise be the case when dilution adjustment is factored in).
- Relevant inefficiencies are not made visible. Aggregated reporting does not show up specific nuances, such as whether a broker is particularly poor in some markets versus others.
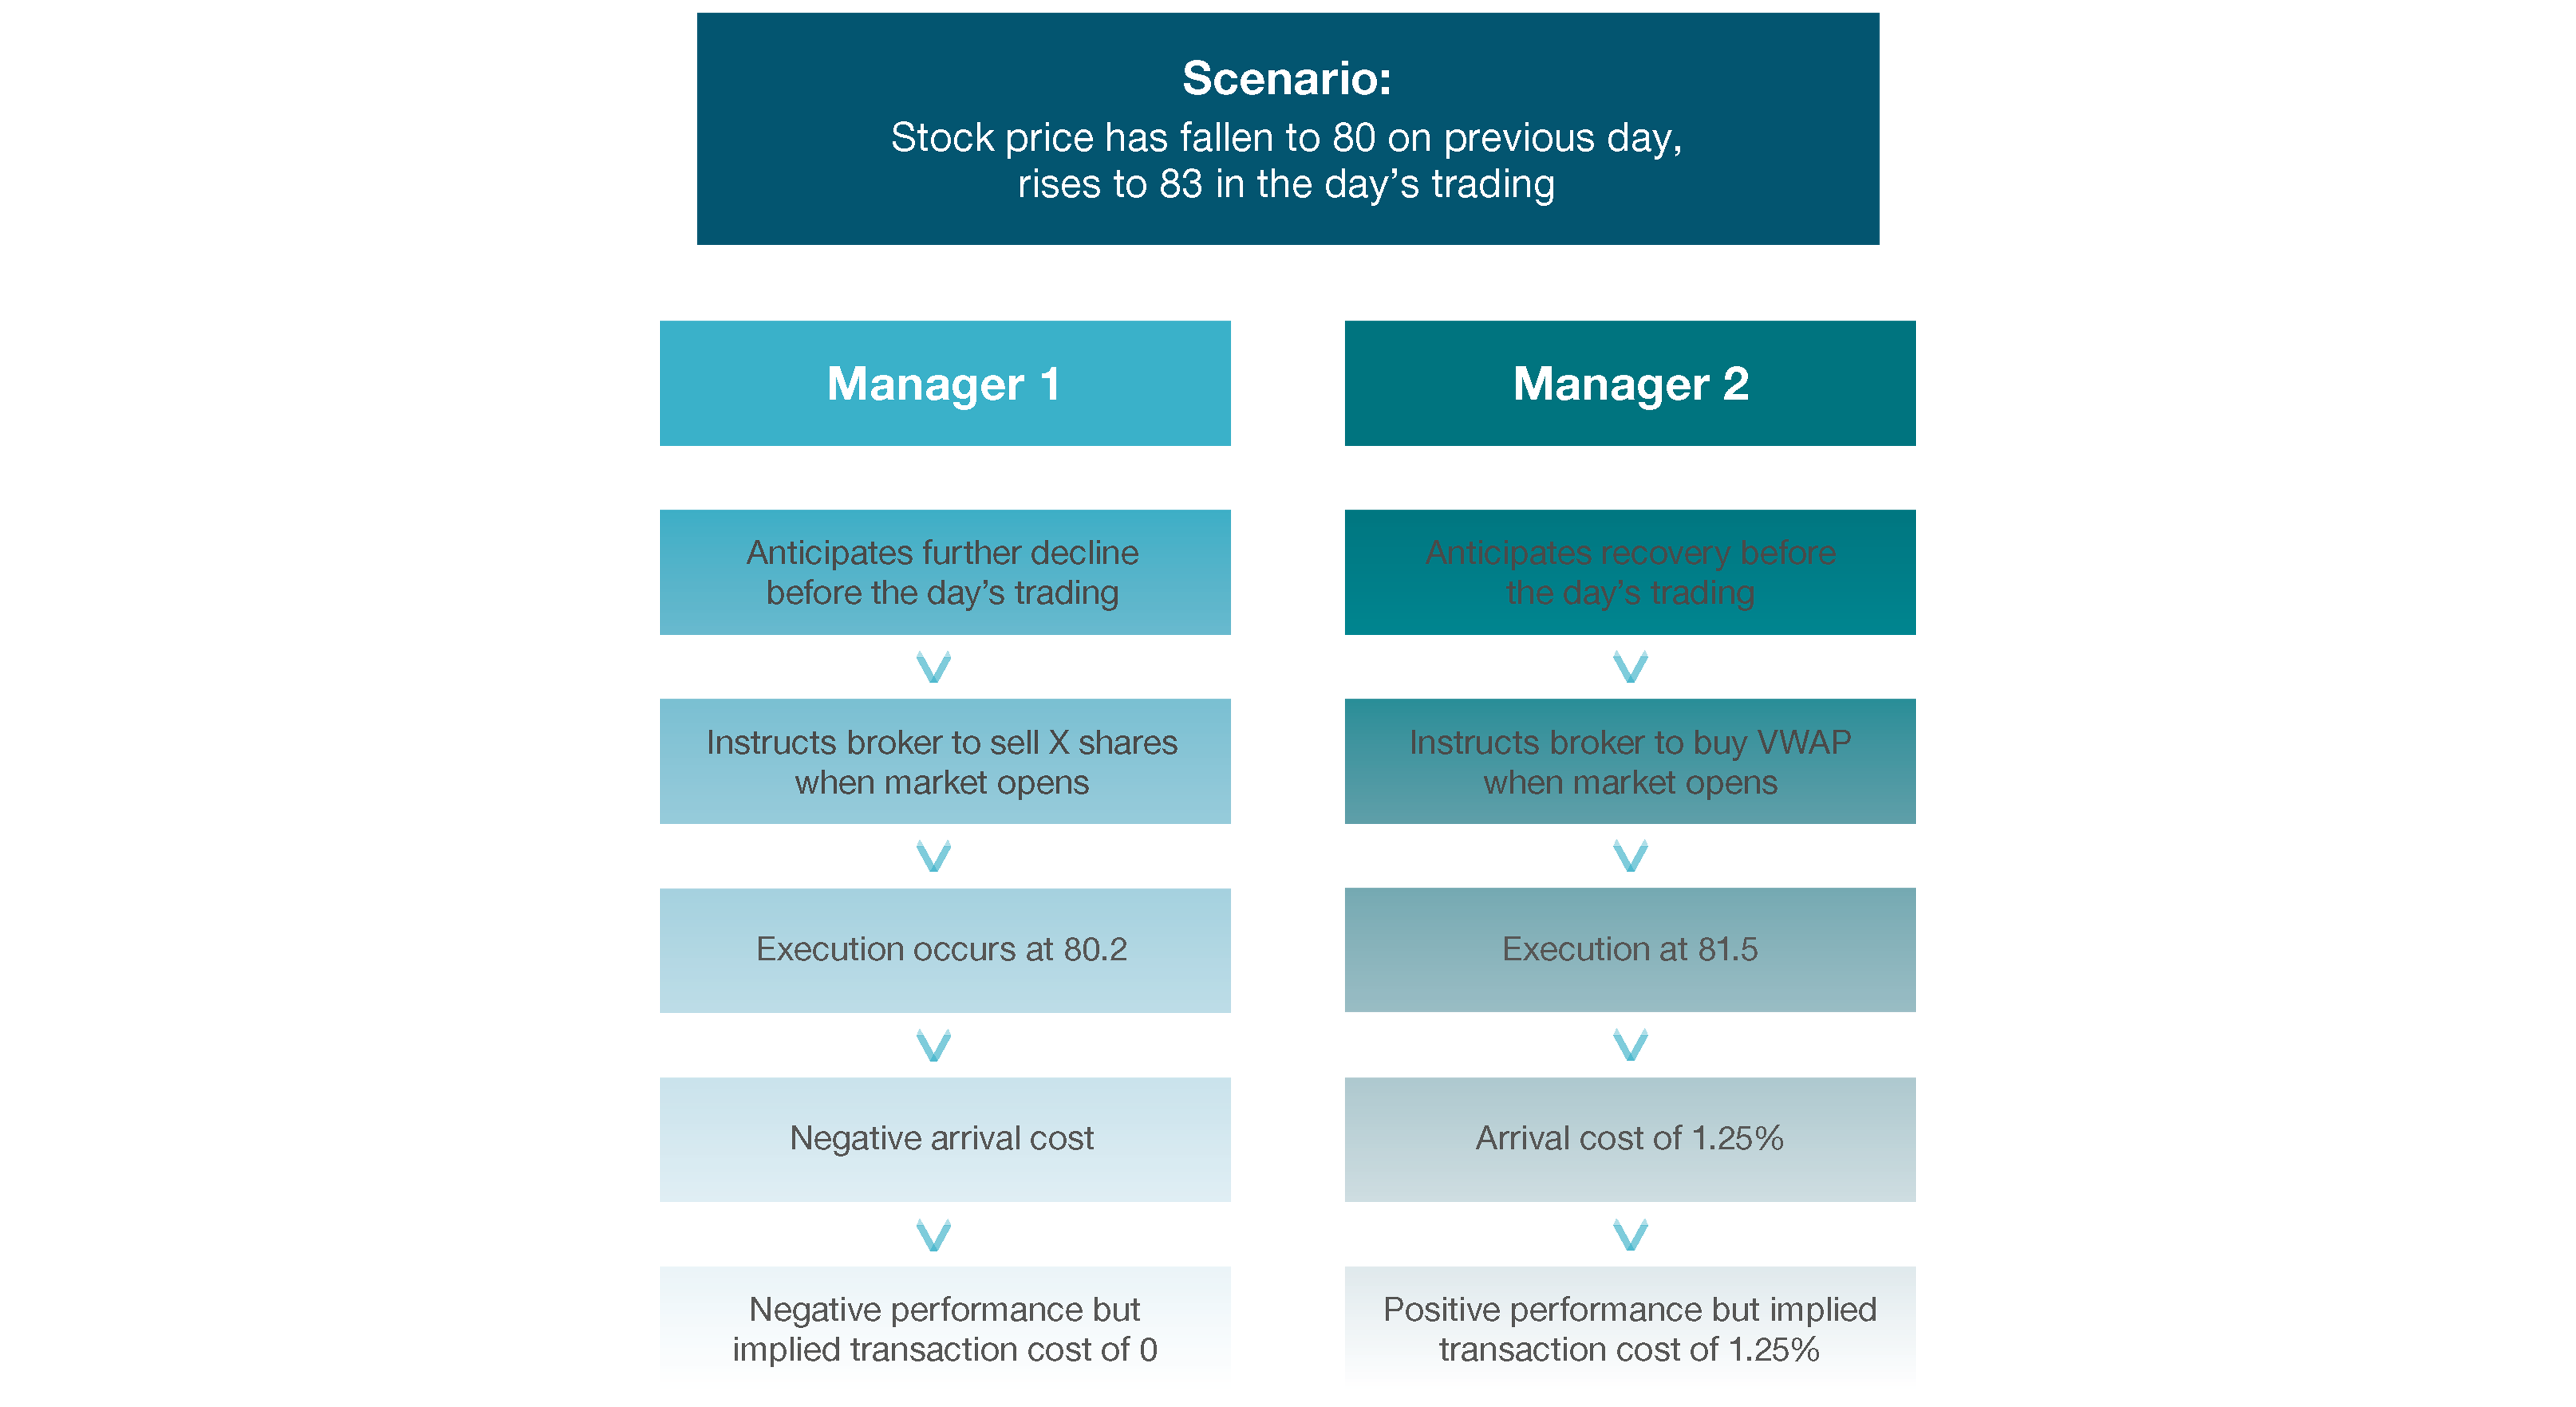
- Lack of context on overall outcomes. Even if the shortcomings about the disclosed numbers can be overlooked, investors are also left with a fundamental complexity: when it comes to transaction costs, lower does not necessarily mean better. For example, a manager that instructs the sale of stock whose price then rises when trading opens may enjoy an implicit transaction cost of zero while the manager who has instructed to buy that stock may suffer an implicit transaction cost, but the latter decision would evidently be preferred from the point of view of overall investment returns.
The institutional initiatives (such as the aforementioned Cost Transparency Initiative) do go further, in terms of enabling a split between the different sub-components within explicit cost, implicit cost and anti-dilution offset. Yet they still do not produce the context required to interpret the numbers.
Figure 2: Transaction costs should be analysed in context. Example: trading a rising stock
With TCA analysis in mind, it is interesting to note the results of recently published survey of senior institutional investors around the globe. Among nearly 200 respondents, fewer than half indicated that they were satisfied with the ‘transparency’ of trading/brokerage costs, while just 23% are satisfied with ‘comparability’ (i.e. the ability to benchmark that cost). The figures for the ‘market impact’ component of transaction costs were even lower, reflecting the persistent low visibility of this cost element. Meanwhile, in both cases, a very large minority of respondents indicated that they ‘don’t know’ whether these costs are transparent, illustrating an ongoing lack of awareness.
Figure 3: Are you satisfied with the transparency and comparability of the following elements of cost?
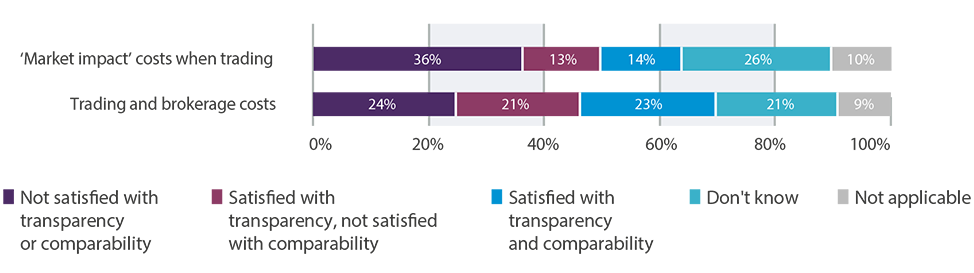
Source: Investors’ Costs and Fees, bfinance Asset Owner Survey July 2023
Figure 4: Have these costs become more or less expensive in the past three years?

Source: Investors’ Costs and Fees, bfinance Asset Owner Survey July 2023
Conclusion: transaction cost analysis models still need work
First and foremost, investors should not expect asset managers’ disclosures—driven by regulation or otherwise—to produce the transparency that is required for (what we view as) good practice on this subject.
Moreover, as with any regulation, investors must stay alert to the potential risk of unintended consequences. Once a cost becomes visible and has to be disclosed, there emerges an incentive to minimise that cost or at least the visible aspect of that cost, especially if the manager believes that the disclosed number may affect clients’ decisions. That incentive may not necessarily be aligned with the ultimate goal: maximising returns.
Three hallmarks of a high-quality transaction cost analysis model:
- All costs, explicit and implicit.
- Diverse metrics such as VWAP, open-close and high-low when benchmarking.
- Contextual insights on aspects such as market conditions, geographic regions, brokerage partners and trade types, to reveal the nuanced impact of order timing and execution within specific contexts.
How can we help you?
Connect with one of our investment specialists today and let us know how we can help.
Important Notices
This commentary is for institutional investors classified as Professional Clients as per FCA handbook rules COBS 3.5R. It does not constitute investment research, a financial promotion or a recommendation of any instrument, strategy or provider. The accuracy of information obtained from third parties has not been independently verified. Opinions not guarantees: the findings and opinions expressed herein are the intellectual property of bfinance and are subject to change; they are not intended to convey any guarantees as to the future performance of the investment products, asset classes, or capital markets discussed. The value of investments can go down as well as up.