 Français (France)
  Deutsch (DACH)
  Italiano (Italia)
  Dutch (Nederlands)
  English (United States)
  English (Canada)
  French (Canada)
bfinance insight from:

Ahmed Mohamoud
Associate, Public Markets - Equity
During 2021-22, the results produced by active equity managers have been heavily influenced by the extent to which their portfolios have been ‘geared in’ to recent inflationary dynamics. Yet those connections are not straightforward: each period of inflation is different, and the world today is very different from the world of the 1970s-80s. With this subject remaining front and centre of equity investors’ minds in 2023—accompanied, problematically, by the spectre of recession—the time seems right to re-examine ‘winners and losers’ in inflationary conditions.
There has been substantial performance dispersion between different types of active equity manager since April 2021. Figure 1 illustrates, at a glance, the excess returns of ten active equity manager composites during the latest period of high and rising inflation. Growth leaning strategies and, to some extent, Quality strategies have struggled; while Low Volatility and Income strategies have (on a median basis) delivered strong outperformance versus the benchmark.
Figure 1: Excess return vs. MSCI World, for ten styles of active equity manager
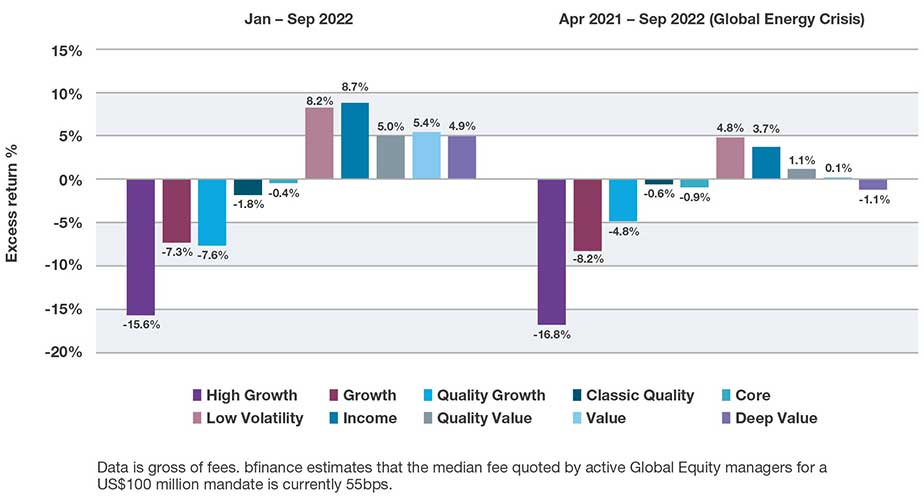
Source: bfinance, eVestment, USD, gross of fees. Figures shown represent the median return of managers in ten of bfinance’s proprietary global equity manager style composites. Each composite comprises a sensible and representative sample of managers in that style, for benchmarking purposes.
To what extent can those distinctions be explained by inflationary dynamics? How have certain investment styles been favoured (or otherwise) due to their tilts towards more (or less) inflation-friendly sectors? The question is a complex one. Before looking more closely at the portfolio tilts of different types of equity manager, it is helpful to review the way in which different sectors and sub-sectors are affected by inflationary conditions.
Sector perspective: ‘winners and losers’
The past 18 months have brought plenty of commentary on which sectors perform better in inflationary environments. Yet investors should always remember that these assertions are typically based on ‘correlation and not causation’ observations. Within broad sector trends, certain sub-industries may be more structurally inflation-resistant than others. Meanwhile, individual companies may not follow the trend of their industries or sector. There can also be starkly different drivers and effects for each inflationary environment, so the relative winners and losers may vary. The direct effects of inflation are difficult to disentangle from the macroeconomic and interest rate environment which will also affect equity returns.
If we look at the past 27 years, we can sample three phases when headline inflation in ‘developed markets’ has been elevated above 3%: April 2021 to September 2022, November 2007 to July 2008 and March 1999 to May 2001. In all three of these periods, year-on-year inflation (as measured by the OECD Consumer Price Index on a rolling monthly frequency) has remained above 3% for at least six months and has shown a predominantly upward trend month-on-month.
Figure 2: Sector performance in three periods of high and rising inflation, February 1995 to September 2022
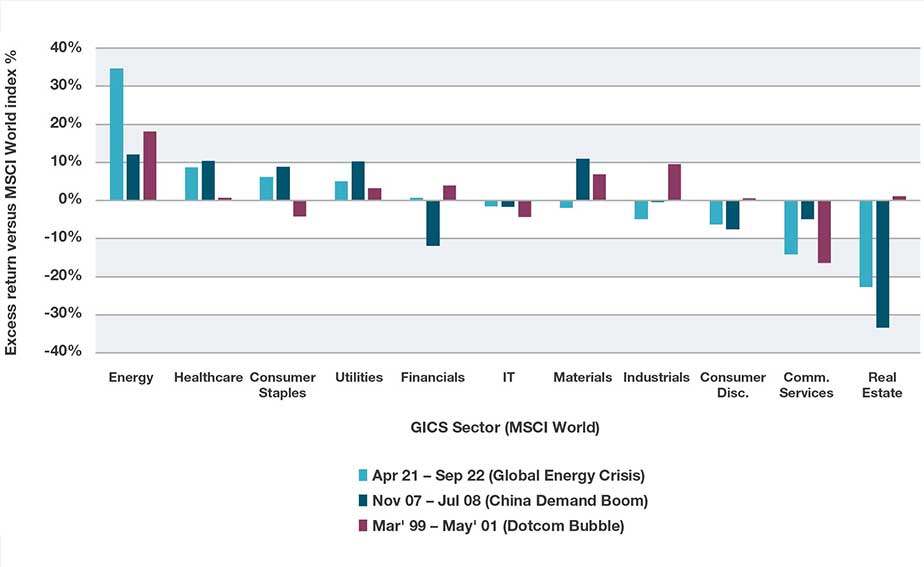
Source: bfinance, MSCI, OECD. Shows MSCI GICS sector net index returns relative to MSCI World (cumulative, USD) in periods of ‘high and rising inflation’. Time periods included: (i) April 2021 – September 2022; (ii) November 2007 – July 2008; and (iii) March 1999 – May 2001. In these periods, year-on-year inflation rates were above 3% for at least six months and showing a predominantly upward trend month-on-month, based on the OECD Consumer Price Index.
An examination of the performance of each MSCI GICS sector index relative to the MSCI World shows some notable performance differences between these three ‘inflationary’ periods, illustrated in Figure 2. For example, the materials sector delivered relative outperformance in the 2007-08 and 1999-01 periods, but not over the past 18 months. This may be explained, in part, by the cyclical nature of the sector; as the sector is tied to the health of the economy, it is not immune from global growth worries driven by (for example) geopolitical conflict, the cost-of-living crisis and lockdowns in key markets like China.
That being said, some associations have broadly held true across all three periods. These are summarised in the table below.
Figure 3: More and less ‘inflation-friendly’ sectors (‘high and rising’ inflation)
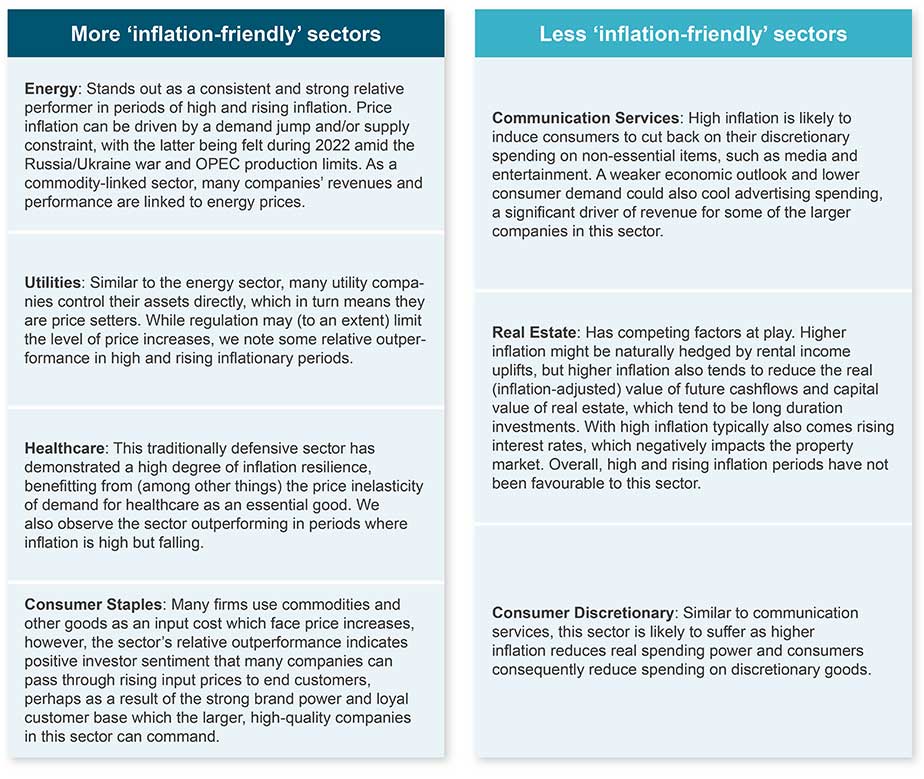
Source: bfinance. Summary based on analysis of periods of ‘high and rising’ inflation, using the same methodology as Figure 2.
Yet it is crucial to remember that inflation moves in cycles: the trend matters as much as the level of inflation. At some point, economies will move from high and rising into high and falling inflation. Utilities, for example, appear to perform relatively well in periods of high and rising inflation but poorly in times of high and falling inflation. Meanwhile, Healthcare may do well in environments of high and rising inflation, whereas it appears to do more poorly in environments of moderate-low and rising inflation, since these periods coincide with improving economic sentiment (which favours cyclicals like industrials, financials and materials versus defensive sectors such as consumer staples, healthcare, utilities). Some of these dynamics are summarised in the infographic below:
Figure 4: Winners and losers in different inflationary conditions (high versus moderate-low, rising versus falling)
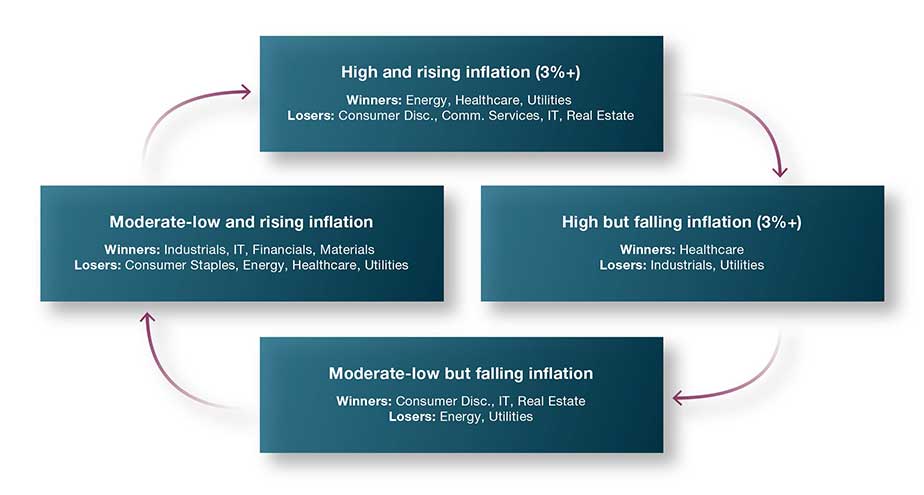
Source: bfinance. Summary based on analysis of periods of “high (>3%)” and “moderate-low” (0-3%) inflation, using the same methodology as Figure 2.
Implications for active manager styles and performance
How might we use the insights on sector performance in inflationary periods to understand the returns of active equity managers, including the recent performance dispersion shown in Figure 1? How might this affect our view of portfolio construction or style diversification going forwards as the inflationary (and potentially recessionary) environment continues?
Figure 5 examines the exposures that global managers of different styles have to the more and less inflation-friendly sectors that were identified in Figure 3.
Figure 5: Median sector weights for global active equity managers, split by investment style
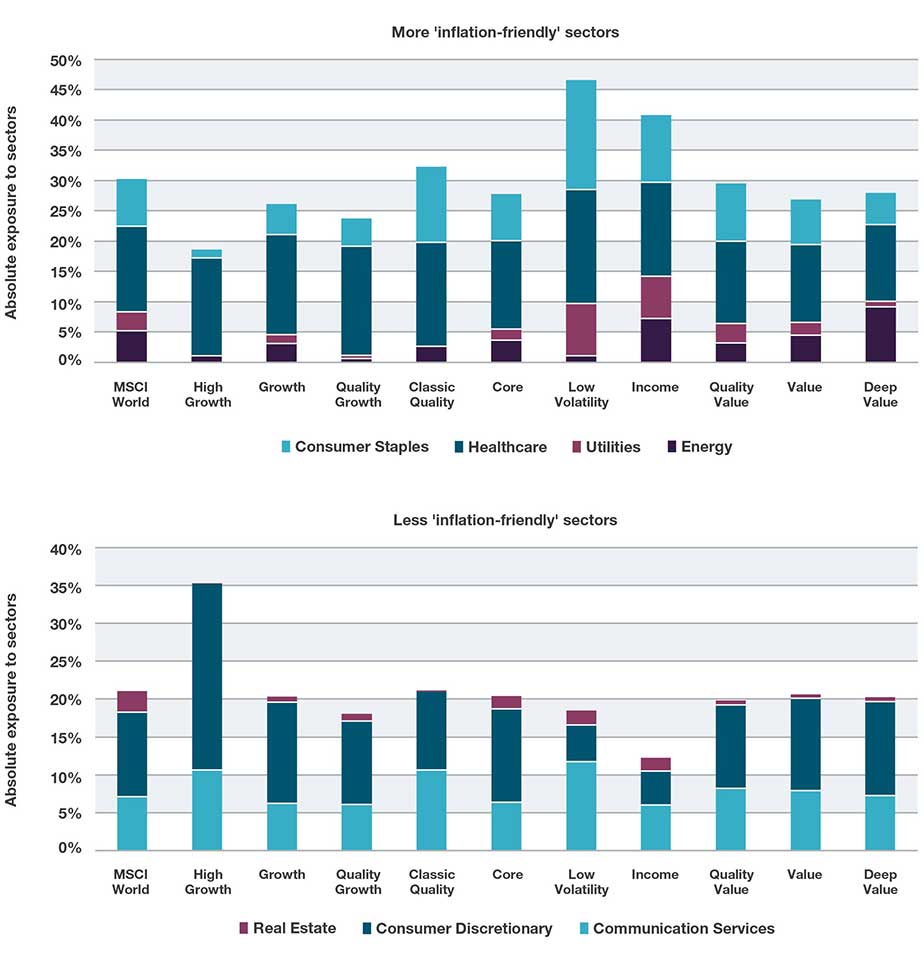
Sources: bfinance, Style Analytics, eVestment. Data as at 30 September 2022. Using bfinance proprietary global equity manager style composites.
Deep Value managers have the most pronounced skews towards the energy sector, a consistent relative winner of prior periods of high and rising inflation. Some constituent oil and gas firms are involved in the entire value chain, so are well positioned to influence and benefit from commodity prices rises. This has been a significant driver of the recent 2021-22 inflationary period, largely due to supply issues stemming from the conflict in Ukraine. However, as Value managers’ sector exposures will be led by perceived valuation opportunities, these current sector skews may not persist over time.
Low Volatility managers tend to avoid areas of the market that demonstrate significant market swings, hence are underweight energy but biased towards stable parts of the market such as Consumer Staples, Healthcare, and Utilities – sectors that have done well in periods of high and rising inflation. Income and Classic Quality strategies exhibit some of these same structural sector biases. These sectors are also more likely to offer some resilience in recessionary environments, making them potentially well positioned for the upcoming period.
In contrast, High Growth managers appear highly structurally exposed to sectors that are less inflation friendly, such as Consumer Discretionary and Communication Services.
However, later in the cycle—when moderate-low and falling inflation takes hold—High Growth managers may experience a tailwind, with likely sector winners including Consumer Discretionary, IT, Financials and Real Estate. Interest rates are likely to be lower, supporting growth, borrowing and greater disposable spending; Energy and Utilities may fare worse in these climates.
As an aside, it’s also worth noting that strategies that apply negative ESG screening to carbon-intensive sectors or take an aggressive carbon reduction target may have (somewhat unintentionally) given up some protection in the most recent inflationary period, given their tendency to be underweight Energy and Utilities.
Looking back, looking forwards
Each inflationary phase has its own distinctive characteristics; history may rhyme but seldom repeats. Historical data should always be handled with care and asset owners should be mindful of maintaining diversification across styles and sectors as we navigate an evolving market environment. That being said, an up-to-date understanding of the relationships between inflation, equity performance and styles can support scrutiny of managers during monitoring and selection. At a higher level, it may also inform overall strategy, helping investors to understand how portfolios are likely to respond in different scenarios.
Important Notices
This commentary is for institutional investors classified as Professional Clients as per FCA handbook rules COBS 3.5R. It does not constitute investment research, a financial promotion or a recommendation of any instrument, strategy or provider. The accuracy of information obtained from third parties has not been independently verified. Opinions not guarantees: the findings and opinions expressed herein are the intellectual property of bfinance and are subject to change; they are not intended to convey any guarantees as to the future performance of the investment products, asset classes, or capital markets discussed. The value of investments can go down as well as up.