English (Global)
  Français (France)
  Deutsch (DACH)
  Italiano (Italia)
  English (United States)
  English (Canada)
  French (Canada)
bfinance insight from:

Bradley Budd
Senior Director, Head of Wealth
Investors considering today’s expanded landscape of semi-liquid or evergreen vehicles for private market investing face a key challenge: navigating asset classes where data and modelling assumptions are often founded on a closed-end fund universe.
Is the jump from closed-end to semi-liquid structures really a matter of “same asset class, different wrapper”? Or does the change in operating model fundamentally alter the risk/reward dynamics to which investors are exposed?
From trickle to flood: semi-liquid takes off
The landscape of semi-liquid, evergreen and open-ended funds has expanded substantially in recent years. Asset classes that were once essentially accessible only through closed-end structures or direct investment–notably private equity and private credit–now feature a growing roster of products. These are designed to make the sectors accessible to a broader range of investors, including wealth clients who often require lower minimum investment sizes.
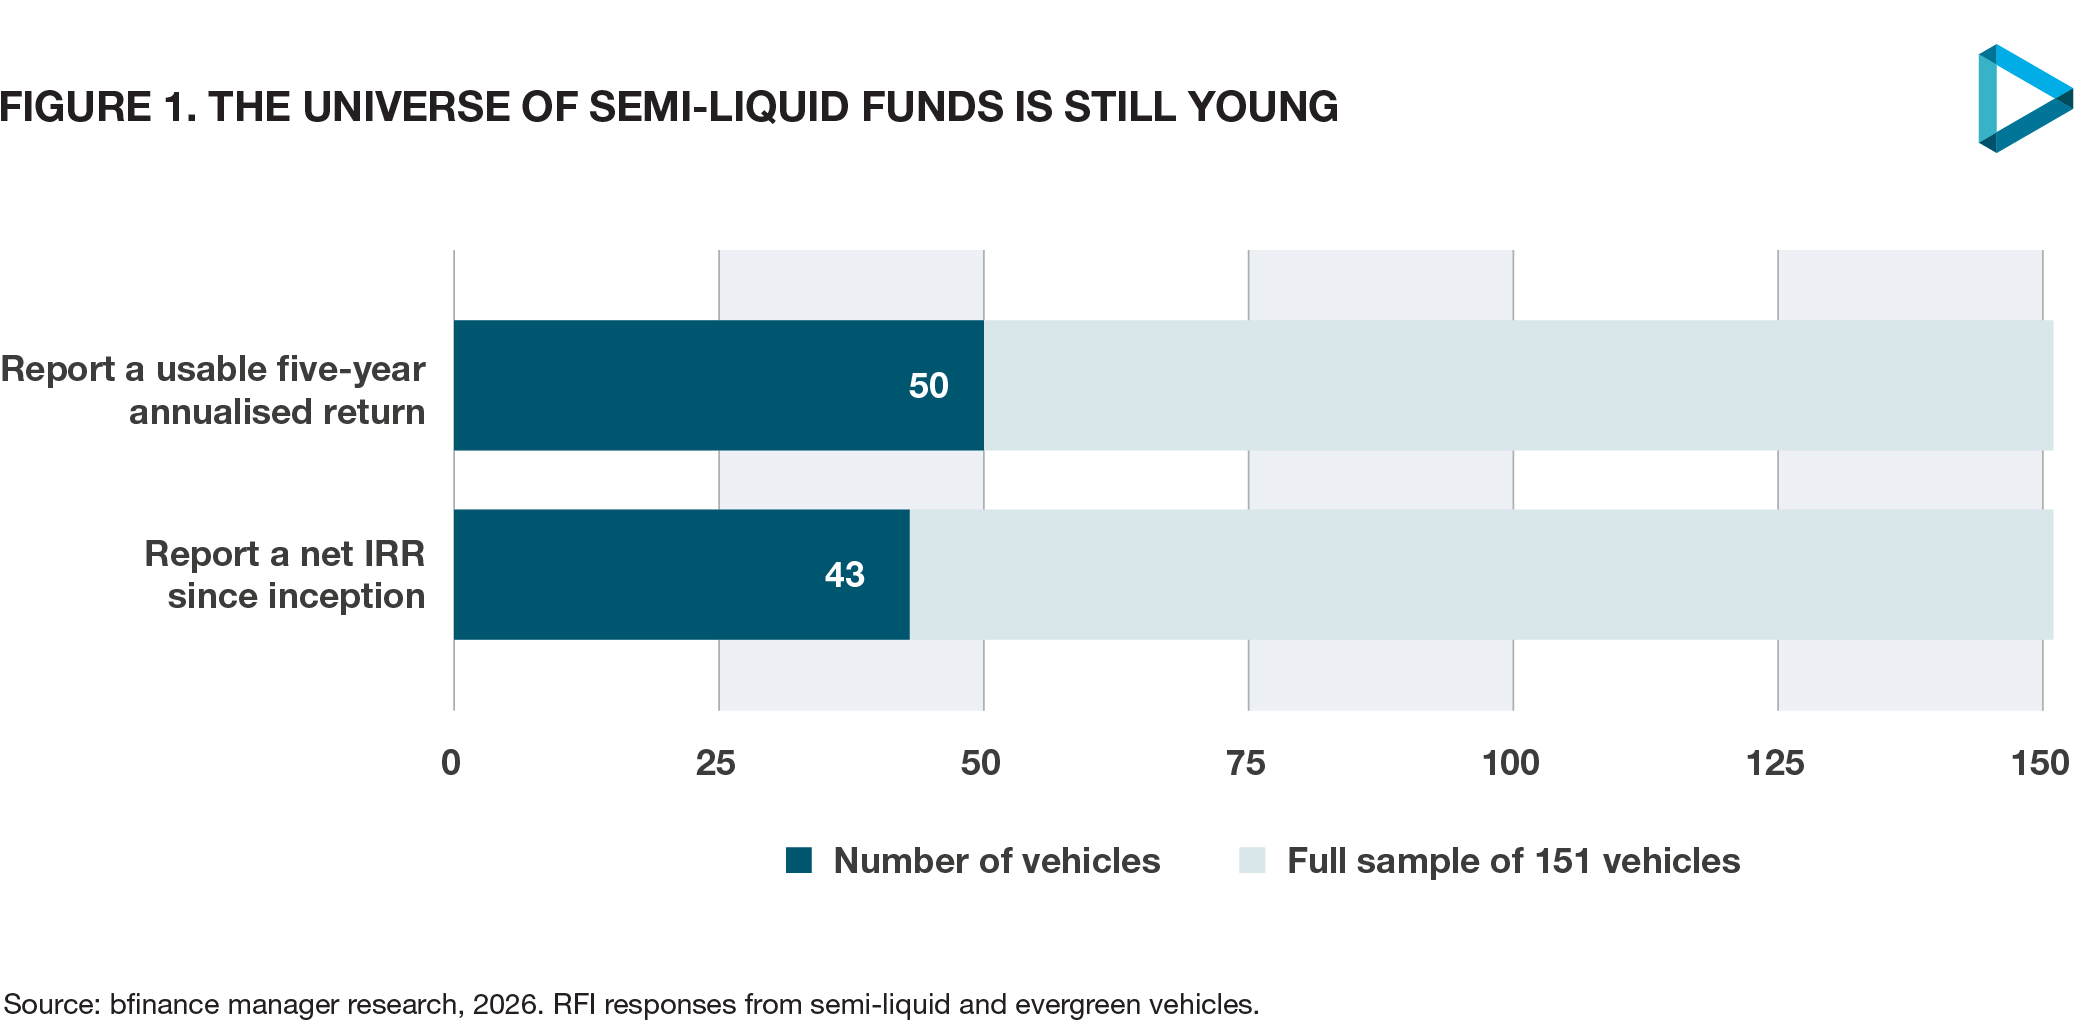
bfinance’s recent manager research illustrates the immaturity of the universe. Across a sample of 151 semi-liquid and evergreen vehicles from 85 firms, the median launch year was 2023 and only 50 can show a usable five-year annualised return. Of the 30 semi-liquid private equity vehicles reviewed, 28 launched in 2020 or later; among the 43 private credit vehicles for which a launch date was available, the equivalent count was 39.
Even within infrastructure–an asset class with a longer history of established open-ended products–immaturity presents a challenge. Within the aforementioned semi-liquid fund review, 25 of the 26 infrastructure vehicles launched in 2020 or later.
Comparing apples with oranges?
While this rapid development creates an evident opportunity for investors, it also poses challenges. For example, robust asset allocation, portfolio design and governance frameworks require an ability to estimate long-term returns, volatility, correlations with major asset classes, cashflows and other characteristics.
With a young strategy universe, allocators frequently rely on assumptions translated from a historic dataset that is dominated by closed-ended vehicles. Investors might well feel uneasy with this transition: can long-term expected net-of-fee returns simply be duplicated, perhaps with a modest haircut reflecting exposure to cash and liquid assets required to support liquidity provisions, or is the data inseparable from the operating model?
Of course, uncertainty is an inevitable part of portfolio construction and implementation: the past is not a predictor of the present. The broader private market investment landscape has undergone profound changes in recent years. Closed-end fund investors have recently been grappling with distribution levels that are low by historic standards. Yet a profound alteration in operating model compounds that everyday predictability problem.
Before considering the unavoidable technical gulf between closed-ended and semi-liquid funds (“Ten differences” below), it is worth noting that the comparability problem goes beyond these technical essentials. Average fund composition may itself differ substantially, beyond the existence of a liquidity sleeve.
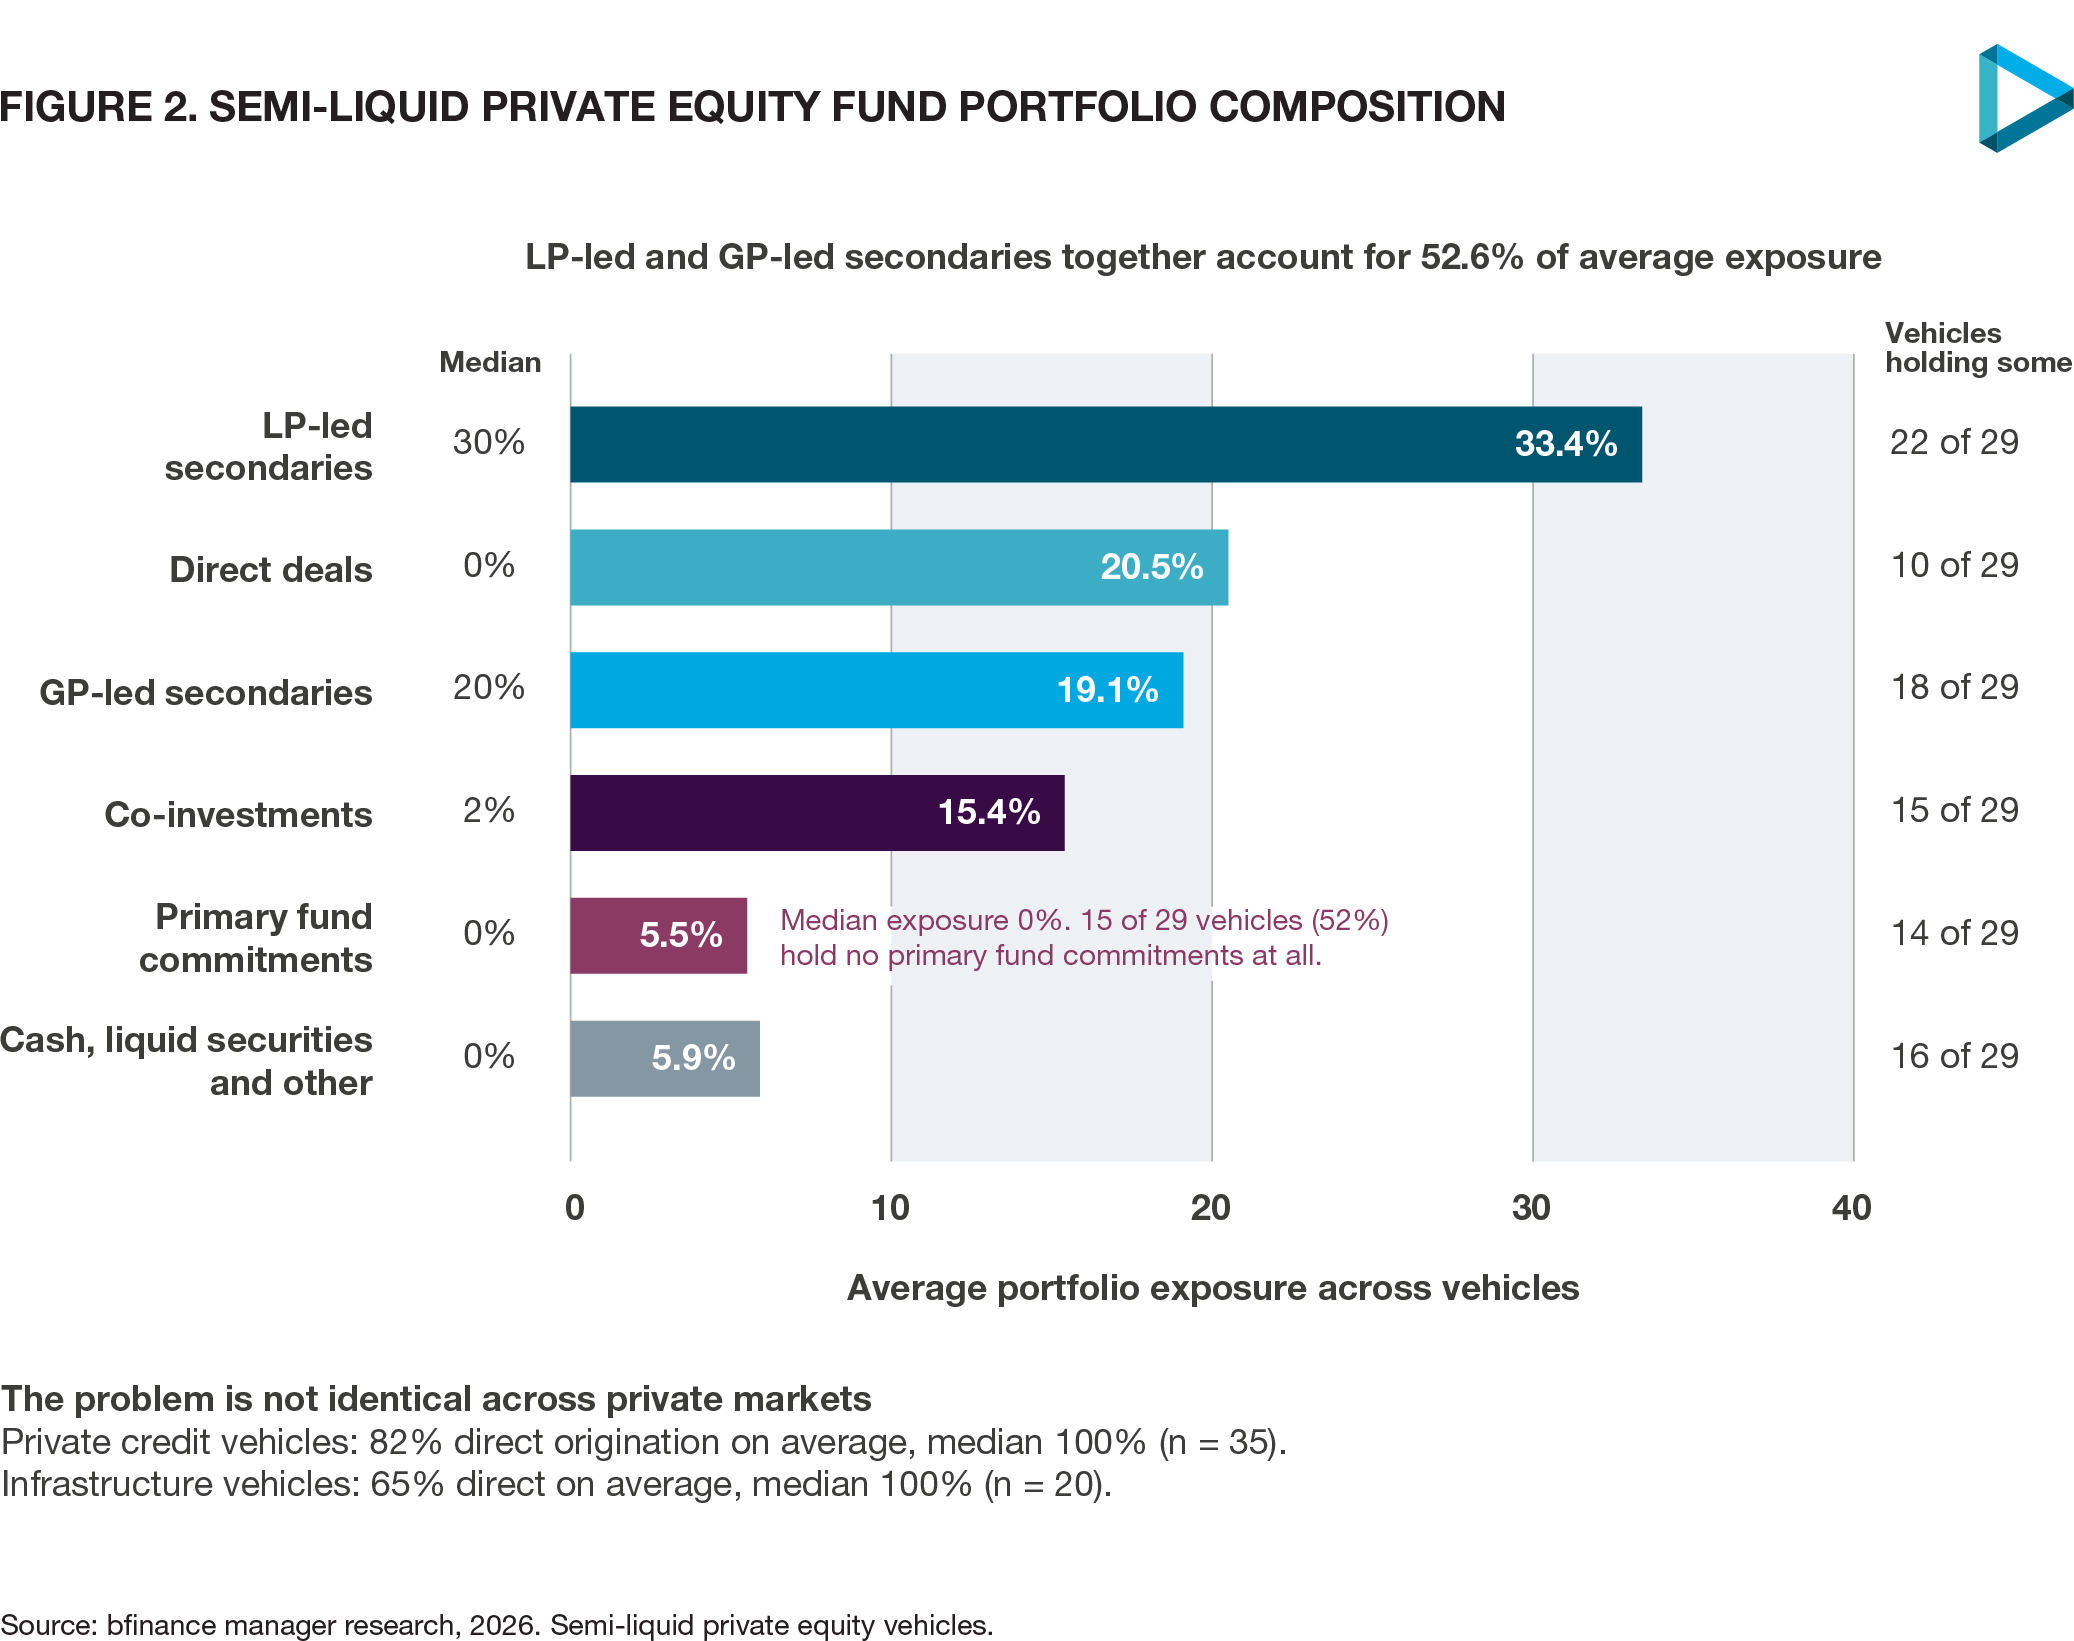
For example, among 29 of the 30 semi-liquid private equity vehicles in the aforementioned broad industry sample, primary fund commitments average just 5.5% of the portfolio and the median is zero; more than half hold no primary fund commitments at all. In the same dataset, the average private credit vehicle comprises 82% direct origination (out of 35 funds) and the average infrastructure vehicle comprises 65% direct origination (out of 20 vehicles).
Ten differences: do they matter?
Even if a group of semi-liquid funds did have comparable underlying exposures to a group of closed-ended funds, a number of key differences would remain. These are summarised in the table below.
The contrasts below inevitably involve some sweeping generalisations. Practices vary substantially by strategy type, geography and regulatory framework. More importantly, individual asset manager choices can affect the degree of risk to the investor that stems from each point.
Performance
| Issue | Closed-end funds | Semi-liquid / evergreen funds |
|---|---|---|
| 1. Return targets and metrics | Performance typically assessed using IRR, MOIC, etc. These reflect timing of capital calls and distributions. | Performance typically expressed through total return, NAV growth plus distributions or yield, and time-weighted or annualised returns. Not directly comparable. |
| 2. Valuation | Valuations typically struck quarterly, sometimes less frequently. Lags do create challenges, but investors do not generally enter/redeem directly at each published NAV. | NAVs may be struck monthly, quarterly or more frequently. Where redemptions take place using those valuations, overly generous pricing can have problematic consequences. |
| 3. Vintage risk | Fund returns are highly dependent on vintage. Investors typically diversify risk by committing across successive vintages. | Perpetual vehicle theoretically reduces vintage risk. However, deployment is not necessarily even through time: fundraising, redemption and exit activity creates periods of rapid/slow deployment. Evergreen does not mean vintage-neutral. |
| 4. Fees | Performance-fee structures typically operate through a waterfall: investors receive capital back, often alongside preferred return, before carried interest is crystallised. | Performance fees may be calculated against changes in NAV, not realised returns. High-watermark structures help but they constrain future fee accrual rather than clawing back fees previously paid on unrealised gains. |
Liquidity
| Issue | Closed-end funds | Semi-liquid / evergreen funds |
|---|---|---|
| 5. Liquid assets | Fund-level cash holdings are limited. LPs maintain liquidity to meet capital calls and receive distributions (liquidity burden sits outside the private-market portfolio). | Vehicle may maintain a meaningful sleeve of cash and liquid securities. Conservative liquid investments create ongoing return drag; aggressive liquid investments may be less dependable precisely when redemption demand rises. |
| 6. Leverage (beyond asset-level leverage) | Subscription facilities often used e.g., to complete investments before cash is drawn from LPs. (This also inflates reported IRR, particularly early in fund life.) | Facilities can be used as a liquidity-management tool, including to meet redemption requests. Note: leverage may increase at precisely the point at which a vehicle is experiencing outflows or market stress. |
| 7. Exits | LP may sell its fund interest in the secondary market. Otherwise, liquidity is broadly determined by asset realisations and wind-down, although fund extensions and continuations mean the timetable is not always clean. | Investors have access to redemption windows, but these are subject to notice periods, caps, gates and potentially suspension. The ability of an individual investor to exit can depend on the redemption activity of other LPs. |
LP experience and governance
| Issue | Closed-end funds | Semi-liquid / evergreen funds |
|---|---|---|
| 8. LP oversight | LP advisory committees can provide oversight and influence over conflicts, extensions and other material decisions. Finite-life structure can also impose discipline around asset realisation. | Governance arrangements vary considerably by vehicle and regulatory wrapper. Some structures provide less scope for LPAC-style involvement, leaving greater discretion with the manager. |
| 9. LP alignment | LPs in a fund are generally exposed to the same pool of assets and the same fund timetable, although co-investment and other arrangements can create differences in exposure. | Investors enter and leave at different points in the portfolio’s evolution. This can create questions around fairness, relating to asset sales, valuations, side pockets and more. |
| 10. LP workload | Cashflow management involves LP workload. Maintaining target allocation and appropriate diversification requires continual evaluation of new funds/vintages. | Day-to-day cashflow management is theoretically simpler. However, requested liquidity may not arrive on a predictable timetable, complicating modelling. |
Liquidity promised and liquidity delivered
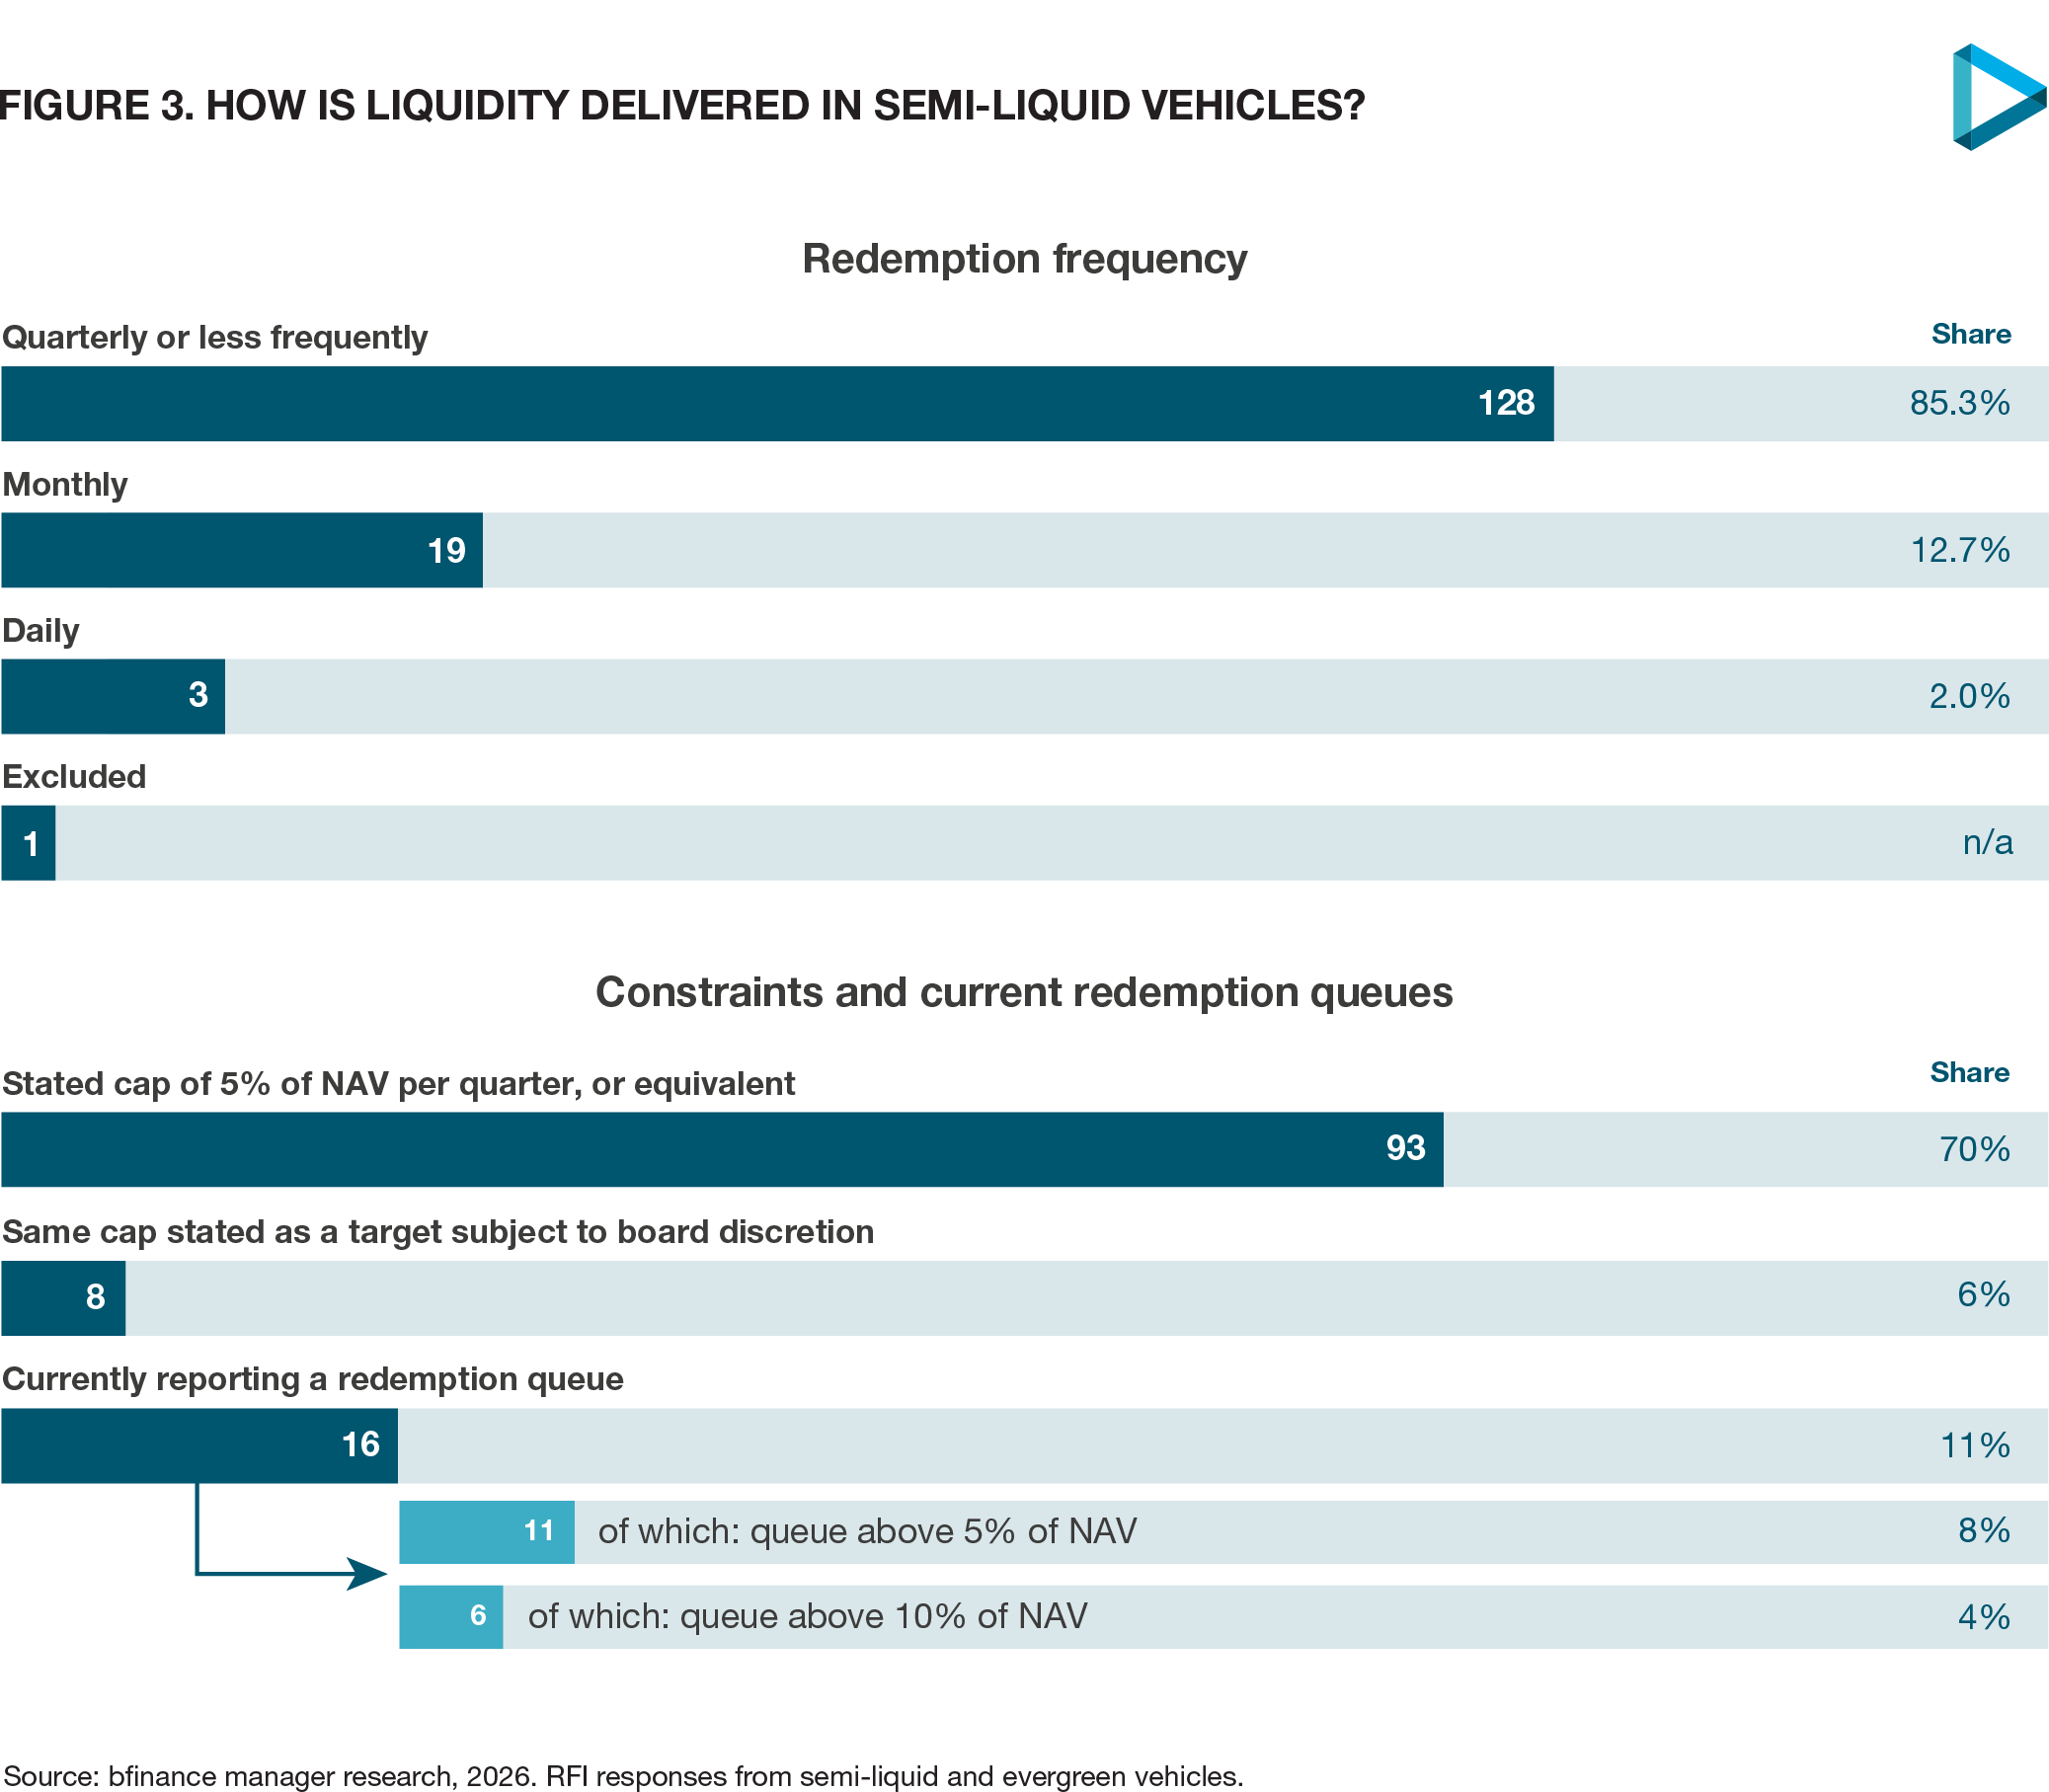
The comments on liquidity above come with an important caveat: “semi-liquid” should not be interpreted as “liquid on demand”. Ten percent of the vehicles examined in this analysis indicated that they currently have a redemption queue and, in half a dozen cases, that queue exceeded 10% of NAV. Gates, caps, notice periods and other mechanisms exist for good reason but the lived experience for investors can sometimes be frustratingly unpredictable.
As such, the key question for investors is not, “How liquid is this fund?” It is: What resources are available to meet those liquidity promises? Or, perhaps even more importantly: what happens to the portfolio–and to remaining investors–if redemption activity increases?
Top-down assumptions; bottom-up due diligence
The differences highlighted above do not imply that semi-liquid private market investing is inherently better or worse than closed-end investing. In several respects the model offers clear benefits: simpler cashflow management, easier maintenance of strategic allocations, reduced dependence on commitment pacing and potentially broader diversification from the outset.
But convenience should not obscure the presence of distinctive additional risks or encourage us to ignore the other ways in which semi-liquid strategies could differ from their closed-ended peers.
Yet how should pragmatic investors address these challenges? From a top-down standpoint, assumptions where asset class data involves different operating models can be handled with care. Meanwhile, vehicle-level due diligence should be viewed as an issue of critical importance. Governance, valuation methodology, fee structures, liquidity resources, redemption terms, use of leverage and exit discipline can all be scrutinised.
Semi-liquid private markets may remove some of the operational complexity associated with traditional closed-end investing. They do not remove the need to understand exactly what is being owned, how returns are generated and how risks are shared.
Source for proprietary figures: bfinance manager research, 2026. Based on information from 151 semi-liquid and evergreen vehicles across 86 management companies, covering real estate, private credit, private equity, infrastructure and insurance-linked securities, with combined net asset value of approximately USD506 billion. The sample is a cross-section of vehicles reviewed by bfinance rather than a complete market universe. Response rates vary by question; denominators are therefore stated where relevant.
Important Notices
This commentary is for institutional investors classified as Professional Clients as per FCA handbook rules COBS 3.5R. It does not constitute investment research, a financial promotion or a recommendation of any instrument, strategy or provider. The accuracy of information obtained from third parties has not been independently verified. Opinions not guarantees: the findings and opinions expressed herein are the intellectual property of bfinance and are subject to change; they are not intended to convey any guarantees as to the future performance of the investment products, asset classes, or capital markets discussed. The value of investments can go down as well as up.