English (Global)
  Français (France)
  Deutsch (DACH)
  Italiano (Italia)
  English (United States)
  English (Canada)
  French (Canada)
 - Nordic endowment
- 2024
- US Small & SMID Cap Equity
- USD 20 million
- At least 2% p.a. gross of fee outperformance vs benchmark over a full market cycle
- Manager research and selection
Our specialist says:
US small to mid-cap equity can offer an appealing, differentiated return stream to add to a long term investor’s equity portfolio. Alpha is often idiosyncratic and company-specific, with portfolios built from a large investible universe reflecting high active share. This contrasts with the index concentration and recent narrow market returns in the US large cap space – which has been a more challenging environment for active managers to outperform.
- 35Longlist

- 9Second stage
- 6Shortlist
- 1Selected
Client-Specific Concerns
The investor had been considering adding active equity exposure in US small or small-mid cap for a long time, attracted by the high potential return generation and a diversifying alpha source in their broader portfolio. A growth – or quality growth – bias was preferred, to complement incumbent value style managers in the endowment's portfolio. Both systematic and discretionary approaches could be considered. Due to domestic legislation imposing client concentration limits in the pooled fund, vehicles had to evidence a minimum of USD 150 million in assets or be expected to reach this level within the next three years.
bfinance value-add:
- Looking beyond fund databases. The investor was open to seeding new fund vehicles and wanted to explore a broad universe of prospective managers. The bfinance 'whole of market' approach helped uncover funds that were in the process of launching with attractive early-investor fee discounts and provide a wider universe of managers to select from than third party existing fund databases could.
- Comparing by market cap. Looking across both small and mid cap, bfinance assessed portfolio holdings on a like-for-like basis to compare exposures, buy and sell sizing discipline, and whether managers' willingness to allow winners to run was value additive. We assigned our own classifications of ‘small’ or ‘SMID’ accordingly. Managers’ own labels and thresholds of small cap varied. Within this search, US ‘small cap’ definitions by managers included:
- companies USD 0.5-10bn market cap at purchase
- companies USD 0.5-6bn market cap at purchase
- companies USD 0.2-5bn market cap at purchase
- companies within the market cap range of Russell 2000 constituents
- constituents of the Russell 2000
- companies with operating revenues below USD 500m at purchase
- Firm scale. bfinance guided the investor towards open search parameters with no minimum firm-level AUM. This kept the door open to small cap specialists that are 'boutique' sized asset managers. Search participants ranged from those with total firm assets below USD 5 billion to behemoth global asset management groups.
- Capacity risks. Approaches to ‘small cap’ or ‘SMID cap’ influenced our assessment of strategy liquidity and the reasonableness of managers’ capacity estimates. We also considered liquidity characteristics, typical trading behaviour and turnover levels, and overlapping strategies (e.g. all cap, or global small cap) managed by the same team/firm.
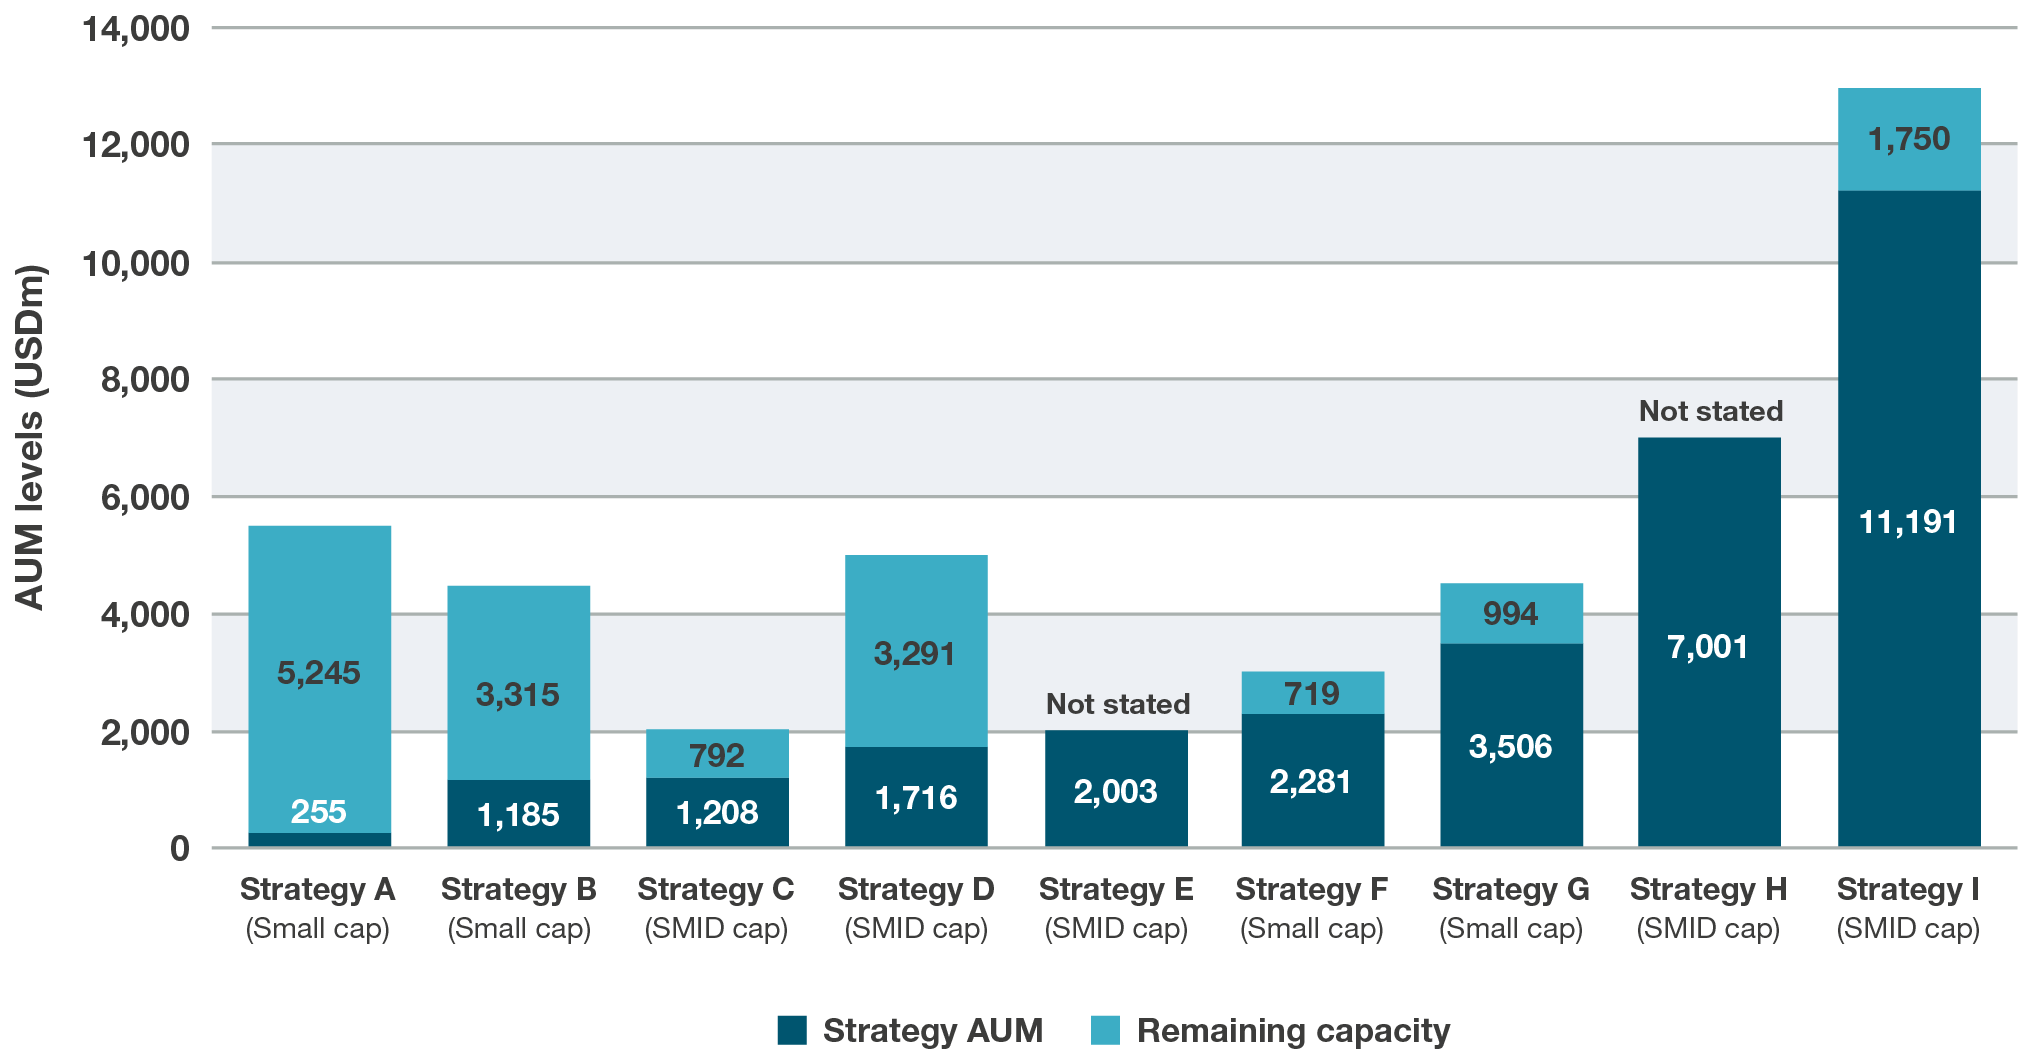
The chart above illustrates some managers’ capacity estimates relative to current strategy assets, and the portfolio’s ‘SMID’ or ’small’ classification assigned by bfinance. Generally, we expect greater scaling potential for SMID cap strategies. We should retain a healthy scepticism of small cap strategies scaling excessively without constraining their small cap universe and impairing their investment approach.