English (Global)
  Français (France)
  Deutsch (DACH)
  Italiano (Italia)
  English (United States)
  English (Canada)
  French (Canada)
bfinance insight from:

Ishan Issadeen
Head of Real Estate
One-year returns are back in positive territory for Core and Core-plus real estate funds, while industry figures continue to encourage a narrative of asset class resurgence after a historic dislocation. Yet this as-yet-anaemic recovery needs careful handling from an investor perspective, with no clear pick-up (yet) in net flows and a number of Core funds still weighed down by redemption queues. One key question, particularly for investors in U.S. real estate, is how to judge the relative appeal of Core versus Core-plus strategies – especially in light of their recent uncharacteristic risk/reward profile.
Open-ended Core and Core-plus real estate funds delivered positive performance in the twelve months to mid-2025, although three-year results are still in strongly negative territory. In the year ending June 30th, U.S. Core funds returned 2.6% net of fees (in USD terms) and U.S. Core-plus funds 3.8%. In Europe, meanwhile, Core funds delivered an average return of 3.6% over the year, beating their U.S. counterparts over both one and three-year periods after a decade of underperformance.
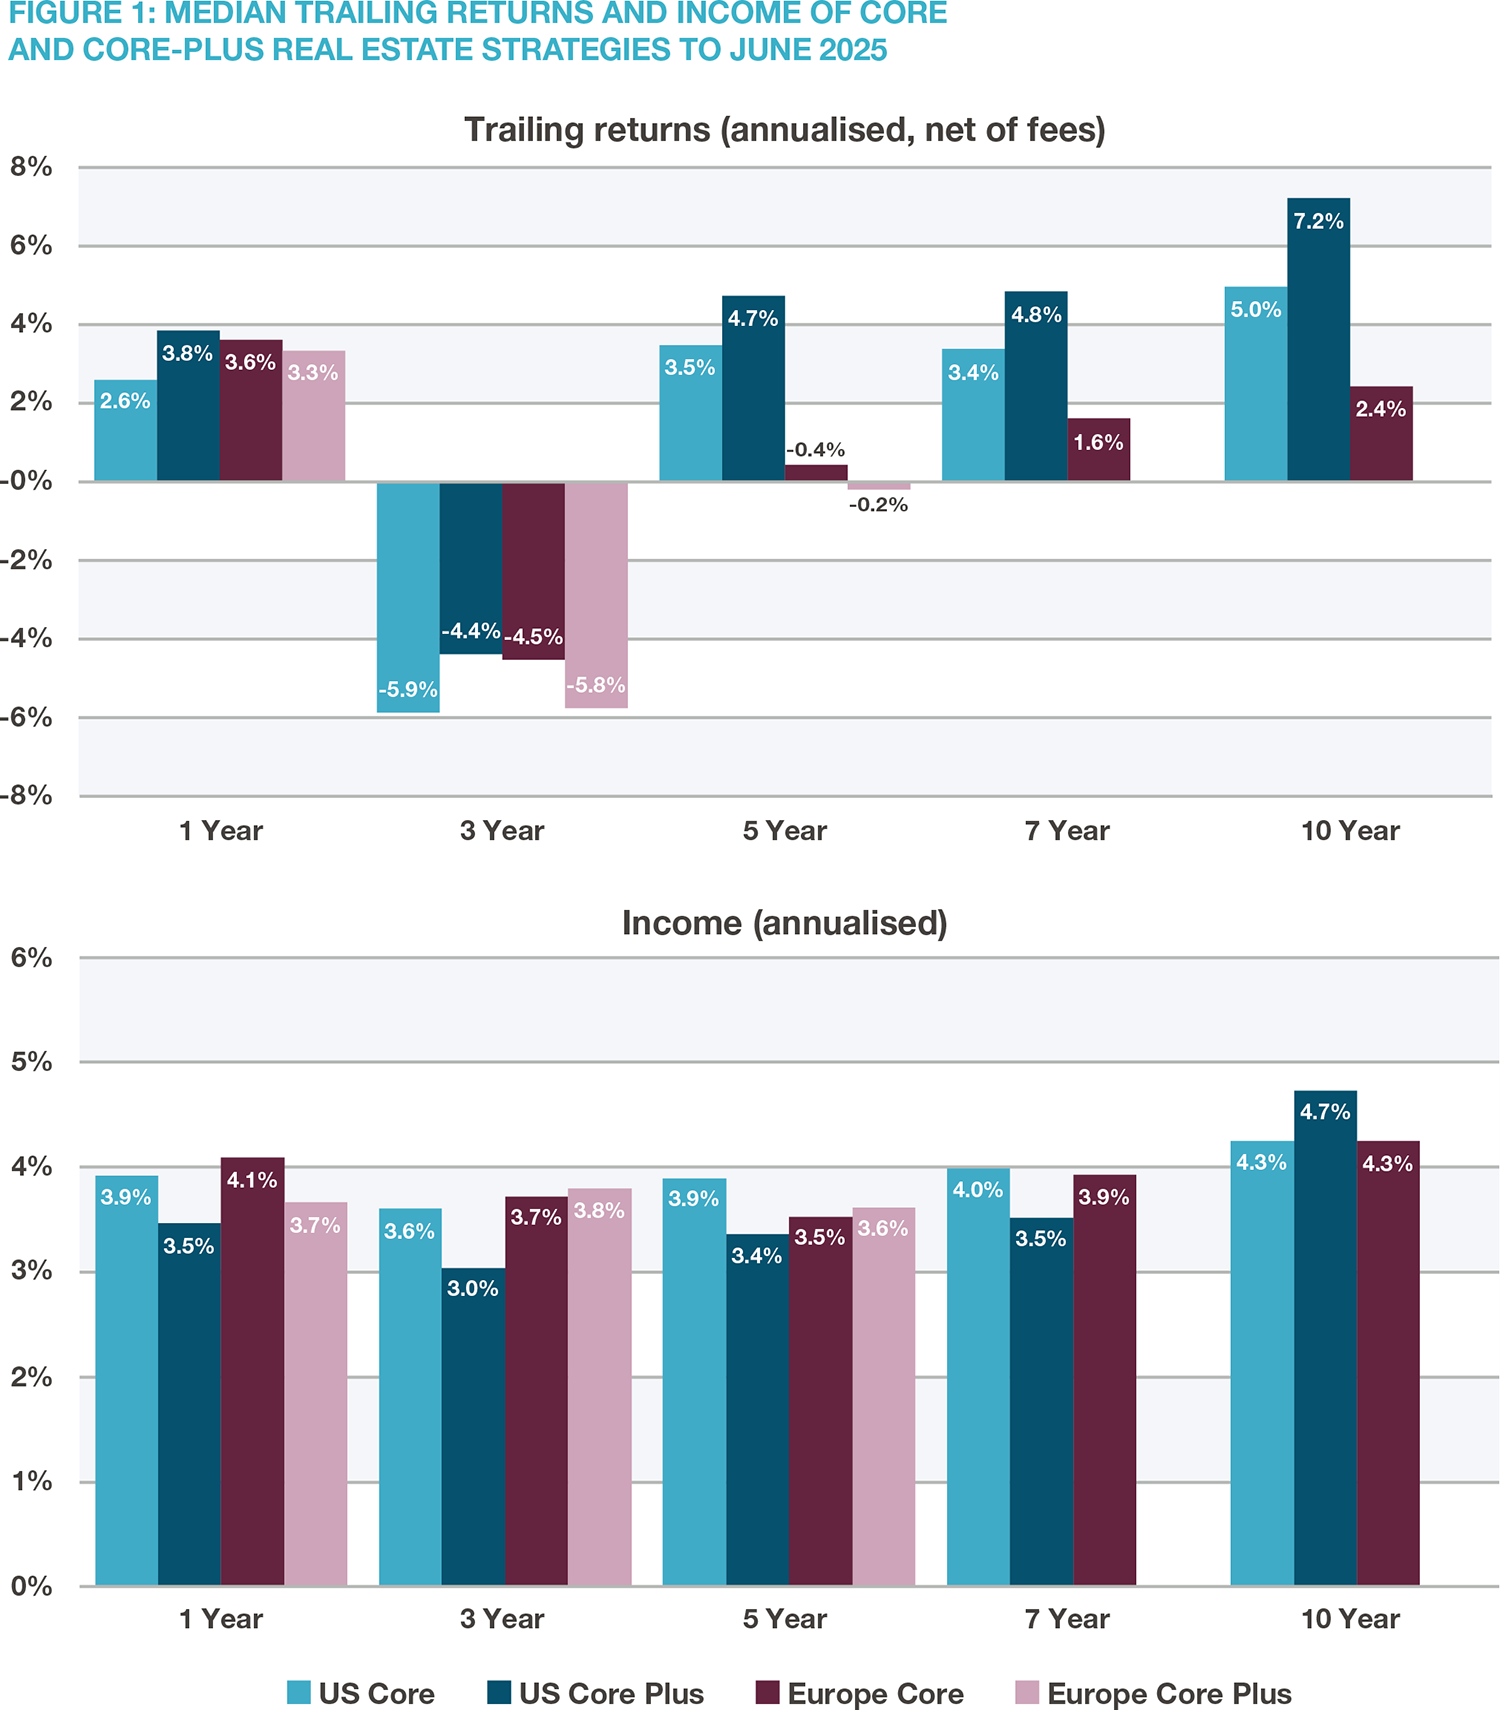
Source: bfinance. Median values based on data from up to 38 US funds and 23 European funds, to end-June 2025. U.S. strategy returns in USD terms, Europe strategy returns in EUR terms. 7 and 10 year data is unavailable for European Core Plus.
While these figures are positive, it would be fair to say that the ‘recovery’ has—so far—progressed more gradually than many industry participants and investors predicted. The 2024 bfinance Asset Owner Survey, for example, showed three in five investors expecting a “moderate (e.g. 5-7%)” recovery in global core real estate valuations between October 2024 and October 2025. Positively-framed narratives remain focused on the pre-conditions for recovery: the attractions of today’s low pricing, lack of new supply (due in large part to inflation), the impact of recent rate cuts, investors’ intentions to increase real estate allocations (reported in some surveys, although fund flow data shown below does not yet evidence a positive trend), and the arguably-greater risk of downward correction in other asset classes.
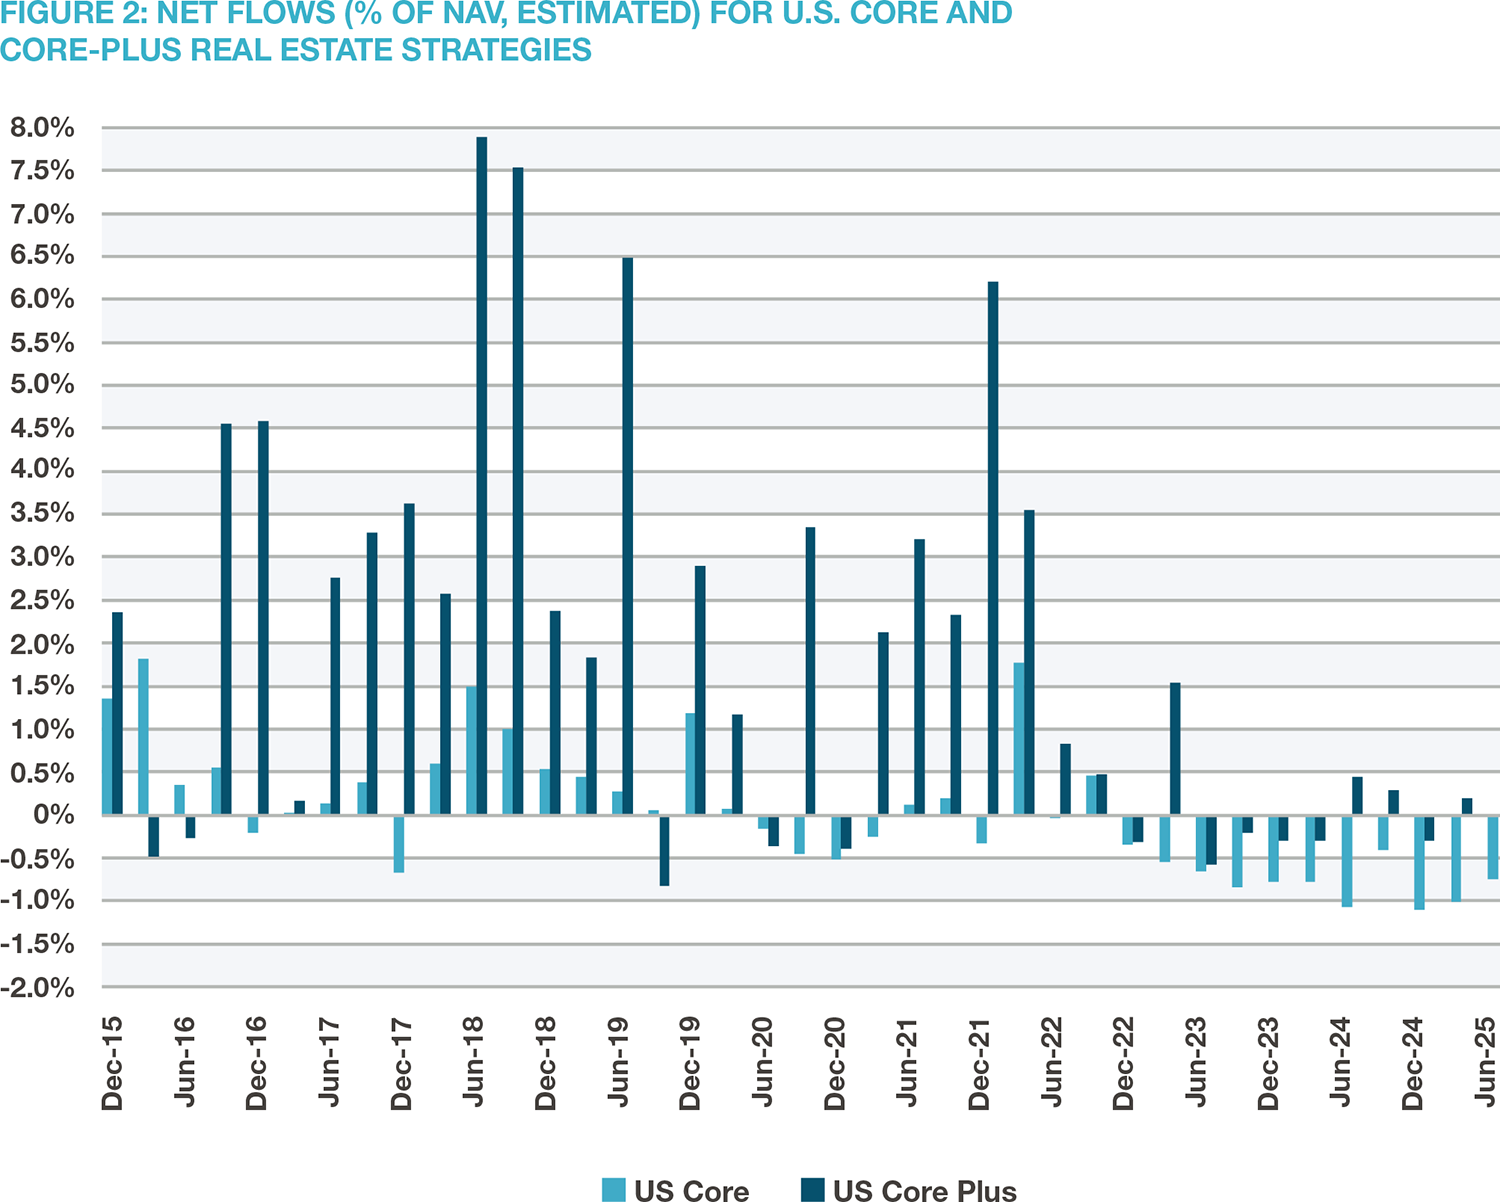
Source: bfinance. Median values based on data from up to 38 funds. Net flows are estimated based on movements in NAV and net performance.
Core-plus appeal?
One particularly interesting feature of recent real estate fund performance, as illustrated above, is the apparent resilience of U.S. core-plus real estate funds versus their core counterparts through a major dislocation. This sector, which came of age in the 2010s as a response to the low-yield environment, sought to carve out a space between conventional Core and Value-Added segments, blending safety with return-enhancing characteristics (including more leverage, with LTV levels in Core-plus around 10% higher, on average, than in Core).
When interest rates surged in 2022, one might therefore have anticipated greater damage for Core-plus strategies. In the U.S., however, these supposedly riskier funds endured less severe losses than their Core peers. Does this mean that investors should re-think perceptions about risk and return across the real estate investment spectrum and—perhaps—the role of Core versus Core-plus exposures in real estate portfolios going forward?
Sector story
It may be helpful to unpick a few of the factors that contributed towards this rather counterintuitive outcome. To a significant extent, the relative resilience of U.S. Core-plus stemmed from more advantageous sector positioning, including lower exposure to Office and heavier use of non-traditional ‘Alternative’ or ‘Next Generation’ real estate sectors such as medical office, life sciences, data centres and self-storage (see Properties of Performance: What Has Set Real Estate Fund Winners Apart?).
Today, U.S. Core-plus funds do still have larger allocations to Alternative real estate and smaller Office exposure than Core funds, as well as higher exposure to the Multifamily sector. One could perhaps debate whether this stance is as forward-looking as it may appear to have been (in hindsight) leading up to 2020. It should also be noted that, as of mid-2025, the average U.S. Core fund actually had lower exposure to the Office sector than the average Core-plus strategy had held during the 2019-2024 period, as well as higher exposure to Alternatives (Figure 3).
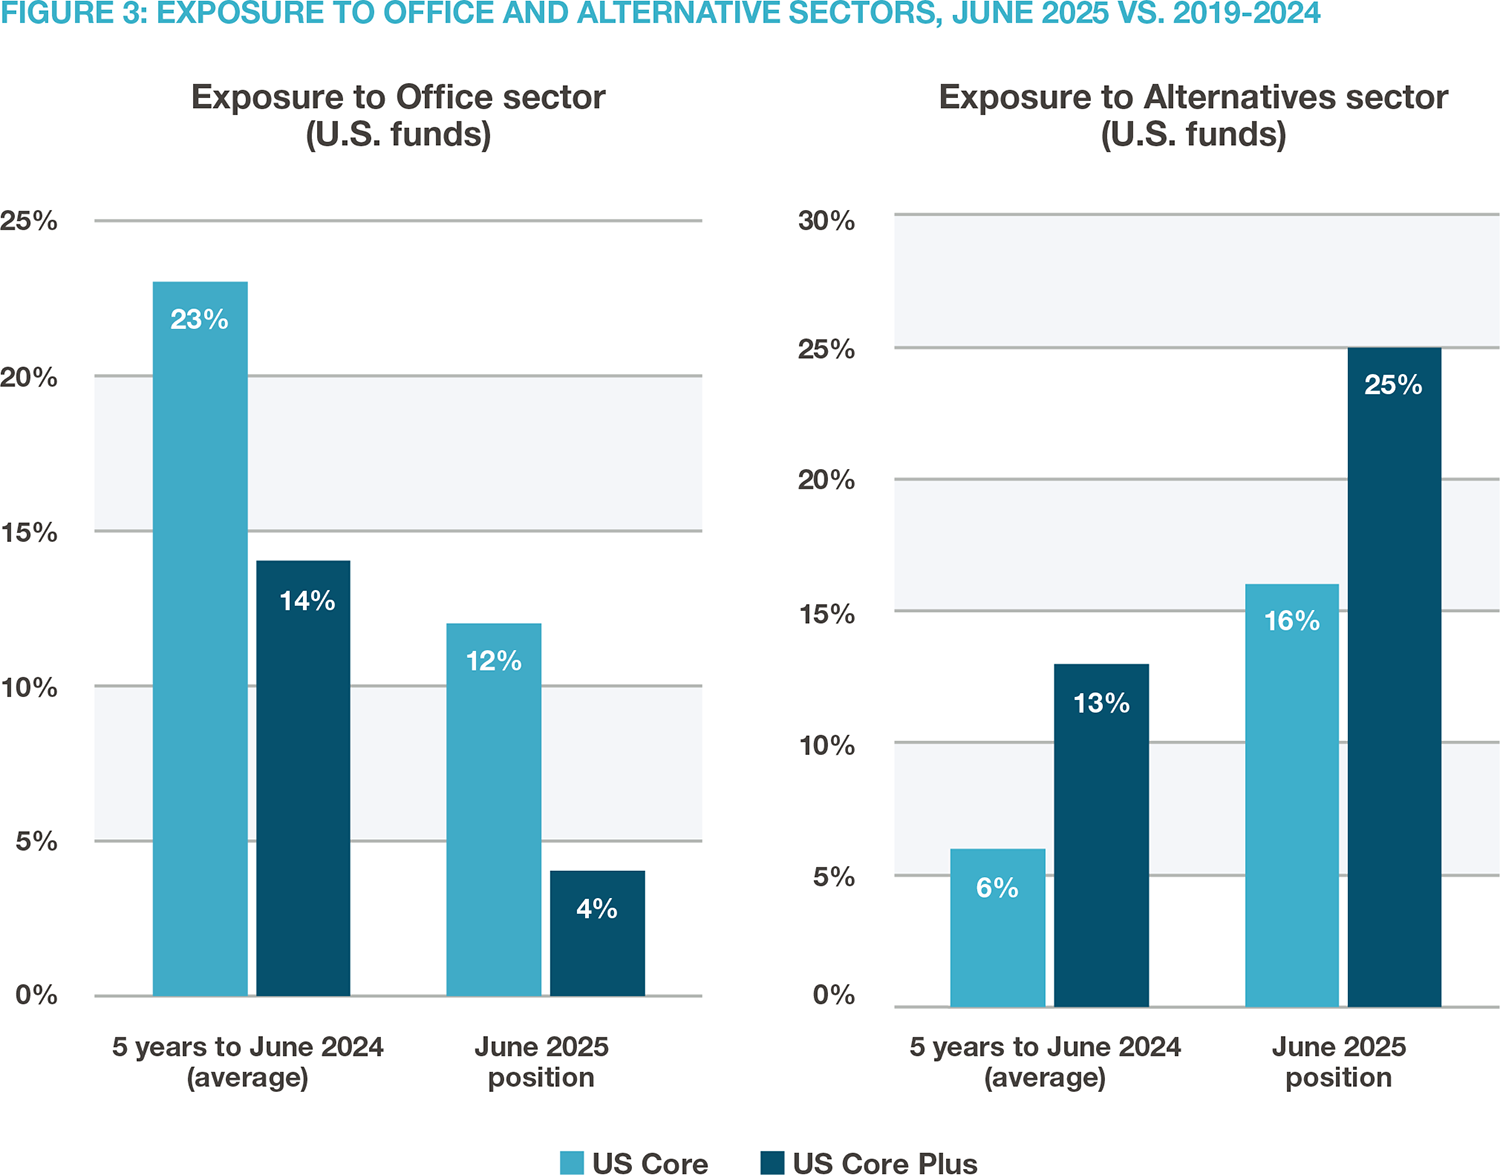
Source: bfinance. Average (mean) sector weights. June 2025 data from up to 38 funds, as in Figure 1. 2019-2024 data from Properties of Performance: What Has Set Real Estate Fund Winners Apart? (January 2025).
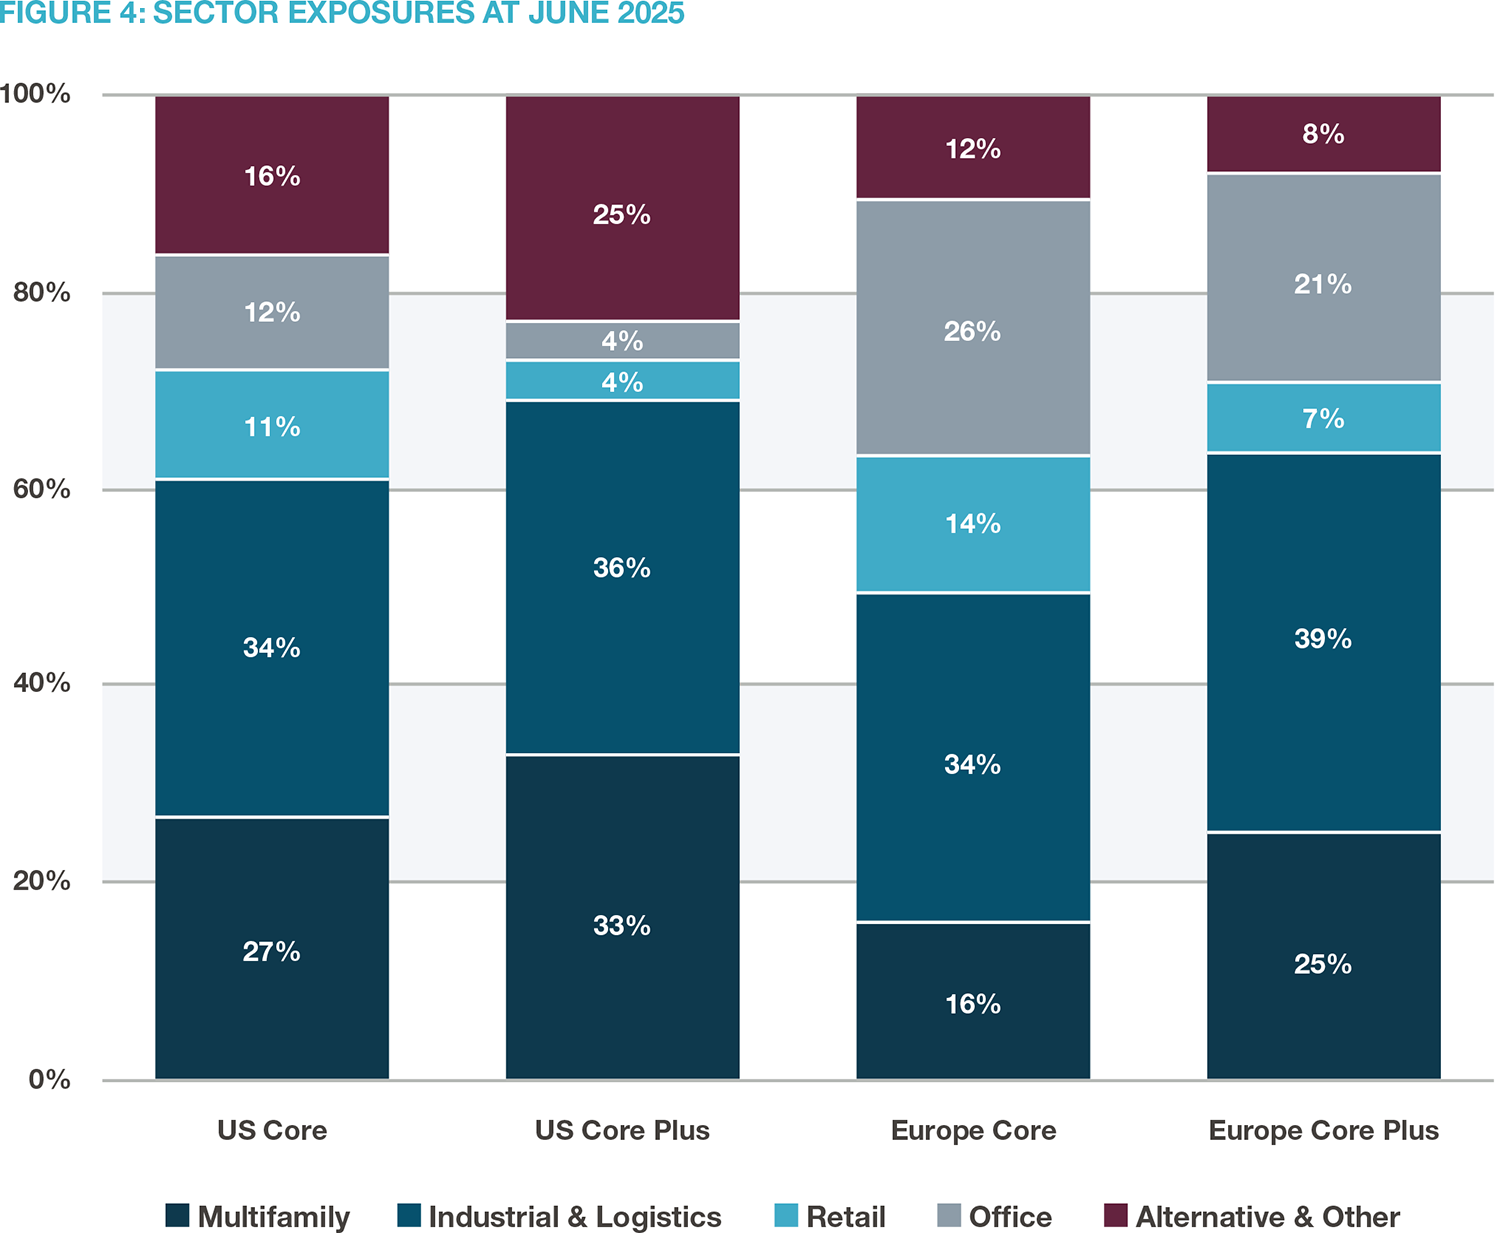
Source: bfinance. Average (mean) sector weights. Data from up to 38 funds, as in Figure 1.
One might argue that Core-plus funds enjoy more flexibility to exercise discretion on sector allocations than their Core counterparts, giving them a persistent strategic advantage. Although both groups have absolute return targets (typically 7-9% for Core and 9-11% for Core-plus), Core funds may be tempted to stay closer to market-like weights due to the existence of benchmarks to which they might reasonably be compared, whereas a Core-plus manager might claim to exercise a more “unconstrained” philosophy or process.
Yet, while true to an extent, this argument should not be taken entirely at face value. Advantageous sector allocations were also heavily facilitated by the timing of strong inflows to the Core-plus segment (see Figure 2), while their (older and sometimes very large) Core counterparts were more firmly anchored in legacy positions. Moreover, the heavier subsequent redemptions from Core funds inhibited their ability (as opposed to their willingness!) to adjust.
Redemption pressures
Today, U.S. Core funds are still experiencing net outflows, as illustrated in Figure 2. As of end-June 2025, the median redemption queue still represented 10% of NAV (Figure 5), although this varies hugely: over a third of the cohort had a queue of less than 5%; the highest outlier was above 50%. Meanwhile, redemption queues for many U.S. Core-plus funds have been erased since the end of 2024 (median 0% at June 2025). The repercussions that redemption pressures can have on subsequent performance have already been noted.
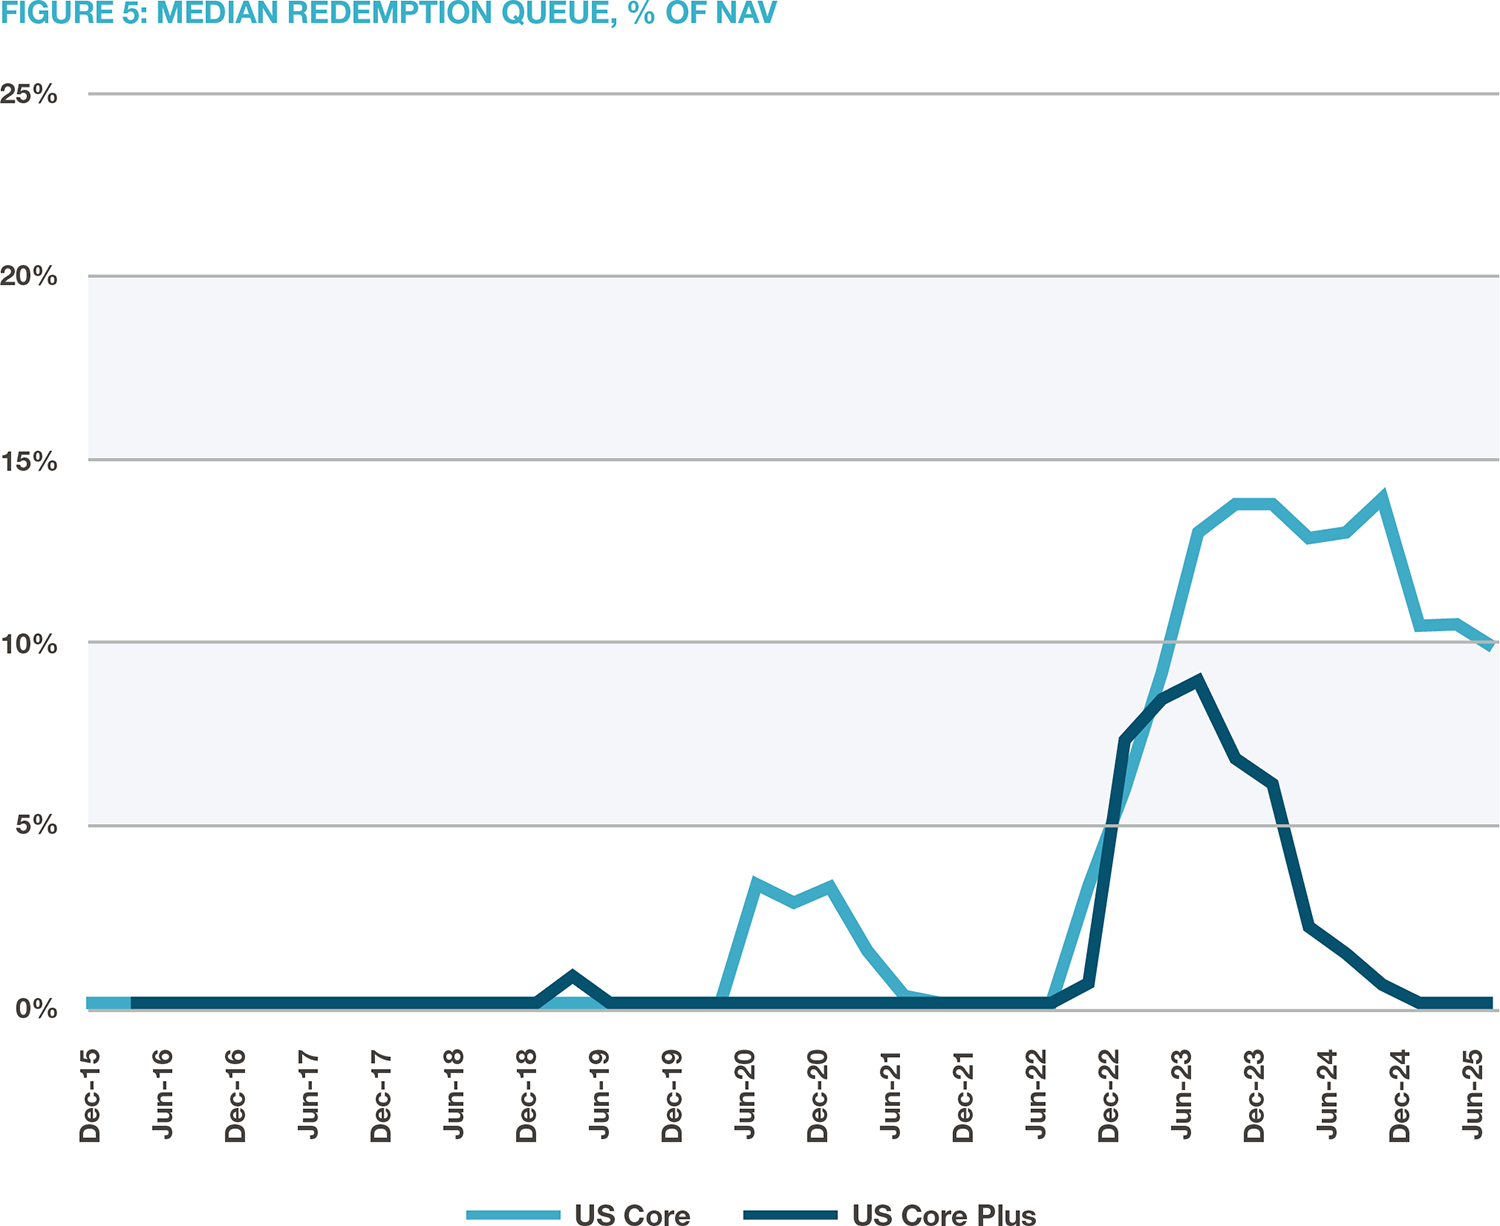
Source: bfinance. Median values based on data from up to 38 funds.
Looking ahead: does the risk/reward paradigm hold?
The apparent resilience of U.S. Core-plus strategies versus their Core counterparts through recent dislocation is interesting, to say the least, and may justifiably affect investors’ strategy-level decisions going forward. That being said, the results can be interpreted as a result of particular dynamics within the real estate market in the early 2020s, especially at a sector level. With interest rate reductions progressing more slowly than many economists anticipated and significant risks to the U.S. macroeconomic picture, the potential benefits of Core—lower leverage and reduced vulnerability to economic cycles—should not be overlooked. Careful manager selection can help investors to avoid fund-specific headwinds.
Important Notices
This commentary is for institutional investors classified as Professional Clients as per FCA handbook rules COBS 3.5R. It does not constitute investment research, a financial promotion or a recommendation of any instrument, strategy or provider. The accuracy of information obtained from third parties has not been independently verified. Opinions not guarantees: the findings and opinions expressed herein are the intellectual property of bfinance and are subject to change; they are not intended to convey any guarantees as to the future performance of the investment products, asset classes, or capital markets discussed. The value of investments can go down as well as up.