English (Global)
  Français (France)
  Deutsch (DACH)
  Dutch (Nederlands)
  English (United States)
  English (Canada)
  French (Canada)
bfinance insight from:

Martha Brindle
Senior Director, Equity

Oliver Wade
Associate, Investment Content
Quality-oriented equity strategies have long been a favourite among institutional investors—but quality indices have struggled to gain traction. When benchmarking style-specific active strategies, asset managers and practitioners often turn to value or growth indices but will rarely employ a quality index to assess a track record. bfinance asks: why is this the case? And how should allocators think about ‘quality investing’ in the wake of recent performance challenges and market volatility?
The quality question
‘Quality’ strategies proved a highly popular ‘style’ choice in active equity manager selection throughout the 2010’s and early 2020’s. While sentiment towards value investing soured and investors grappled with the risk that a historically long, growth-driven bull market would come to an end, quality offered the best of both worlds: a growth-leaning tilt that captured the tech surge, yet with a reputation for resilience during downturns.
Notably, a quality foundation is common across styles. In value strategies, balance sheet strength contributes towards value trap avoidance. In growth approaches, quality characteristics—such as durable competitive advantage—support sustainable earnings growth projections. Yet despite this broad investor appeal, quality indices never became a go-to tool for benchmarking. What explains this disconnect? To a large extent, allocators may take inspiration from their asset managers, as even those managers with an explicit quality focus rarely use quality indices as a reference point—preferring instead to use broad market indices. This is a notable contrast with value and growth, which are widely used as a secondary style benchmark—in some cases (particularly in the US) even a primary benchmark—for relevant active strategies.
But why? The argument often given is that quality indices do not capture the myriad ways in which active managers typically define and seek quality. MSCI’s Quality factor, for example, is built on three financial metrics—return on equity (ROE), earnings variability, and debt-to-equity ratio. While these are useful indicators, they are backwards-looking and fail to account for forward-looking elements, such as threat of competitive disruption, management quality, and long-term sustainability of earnings—factors that will (almost without exception) be considered by active managers in determining quality. Practitioners may also assert a more disciplined approach to valuation, helping to counteract one of the key risks in quality investing—exposure to ‘high quality’ but over-valued stocks. Moreover, it’s worth considering sector biases in quality indices: their overweight stance in IT, healthcare, and communication services can lead to return patterns that are more dependent on sector trends than on the quality factor itself.
Does quality equal growth?
We have observed—both through return patterns and holdings similarity—that quality indices have become increasingly ‘connected’ to growth indices. In Figure 1 (below), we show rolling correlations between the excess returns of the MSCI ACWI Growth and MSCI ACWI Quality versus the MSCI ACWI. These averaged 0.4 for the periods ending 2011-2016 and fluctuated in that time. Since 2018, the correlation has been higher—above 0.6—and stickier.
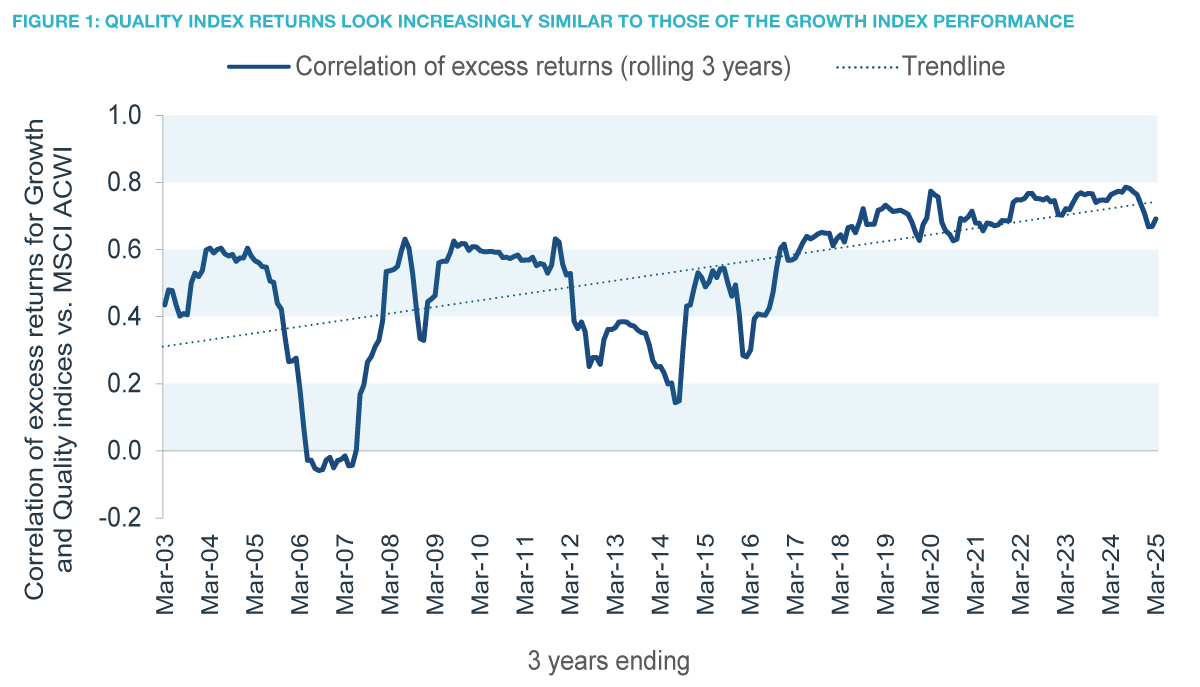
Source: bfinance, eVestment, USD net index returns to March 2025. Indices used: MSCI ACWI Quality, MSCI ACWI Growth, MSCI ACWI . Calculated on a monthly basis.
As of the end of March 2025, 7 of the top 10 constituents of the MSCI ACWI Quality index are also among the top 10 of the MSCI ACWI Growth index—including Alphabet, Apple, Meta, Microsoft and NVIDIA. Such data suggests that quality indices have increasingly behaved as a subset of growth rather than representing a truly distinct style.
The big question: has quality lacked resilience?
Quality is perceived as a defensive style of equity investing, offering protection in drawdowns. While this holds over time and through longer periods of assessment, recent performance indicates a different story, as shown in Figure 2.
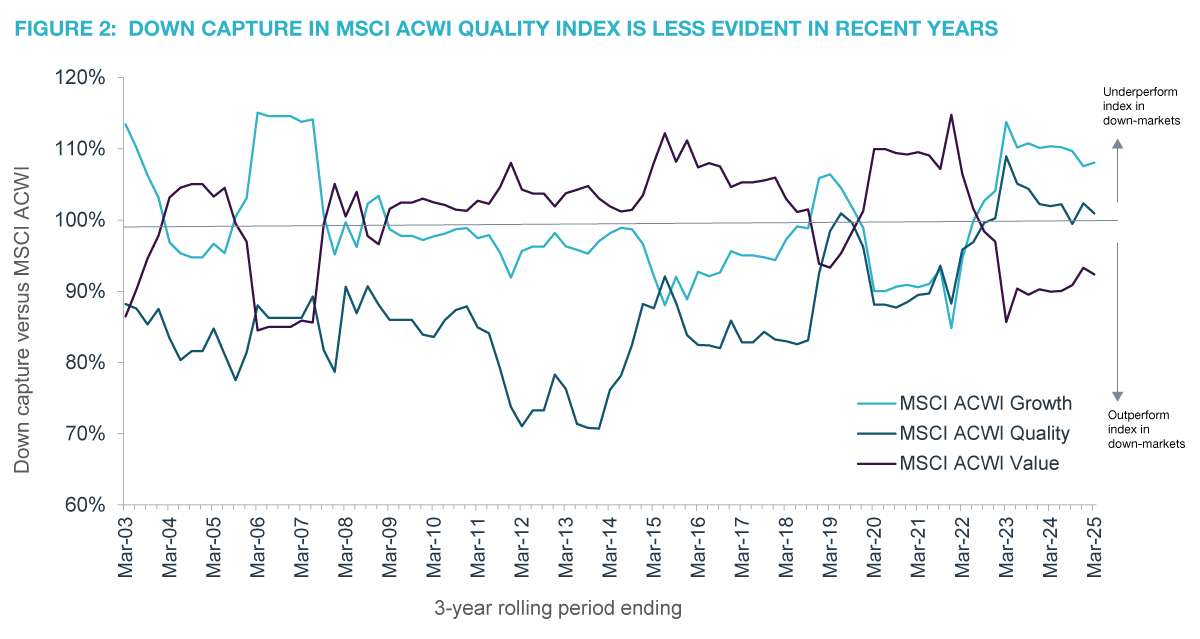
Source: bfinance, eVestment, USD net index returns to December 2024. Calculated on a monthly basis.
A downside capture ratio above 100% can be interpreted as “declined by more than the market in a downturn”; one would therefore expect the defensiveness of quality to show through with downside capture below 100%. However, recent three-year periods show MSCI ACWI Quality index performing worse than the market during drawdowns. Figure 2 shows that the downside capture of the MSCI ACWI Quality index is notably higher (meaning weaker) in recent rolling three-year periods than in the past. This suggests the quality index’s resilience is evidently harder to validate in recent markets—in fact, it looks strikingly similar to the growth index.
The MSCI ACWI drawdown over calendar 2022 (-18% in USD net terms) saw the MSCI ACWI Quality fall even further (-23%). This counterintuitive lack of downside protection in the quality index was due to the unusual nature of the 2022 market decline, in which the Energy sector was the only sector to generate positive returns and traditionally defensive ‘long duration’ stocks derated amid rising interest rates, inflation and recessionary fears. Contrast this downturn with the Covid crash: this unusual market decline saw technology stocks heavily insulated due to strong lockdown-related demand for digital services, benefiting indices (including the MSCI ACWI Quality) with overweight positions to the sector.
Nuance is needed in assessing performance during falling equity markets: there is some truth in the adage that ‘this time, it is different’. Market downturns are not created equally, and we should not expect the same trends to play out each and every time.
Year to date in 2025, the global equity market sell off has brought portfolio defensiveness into sharp focus. Whilst short-term market moves should not be the emphasis of a long-term investor, it is interesting to observe that the MSCI ACWI Quality (and MSCI ACWI Growth) both fell more than the MSCI ACWI since the prior market peak in mid-February through to early April (the time of writing).
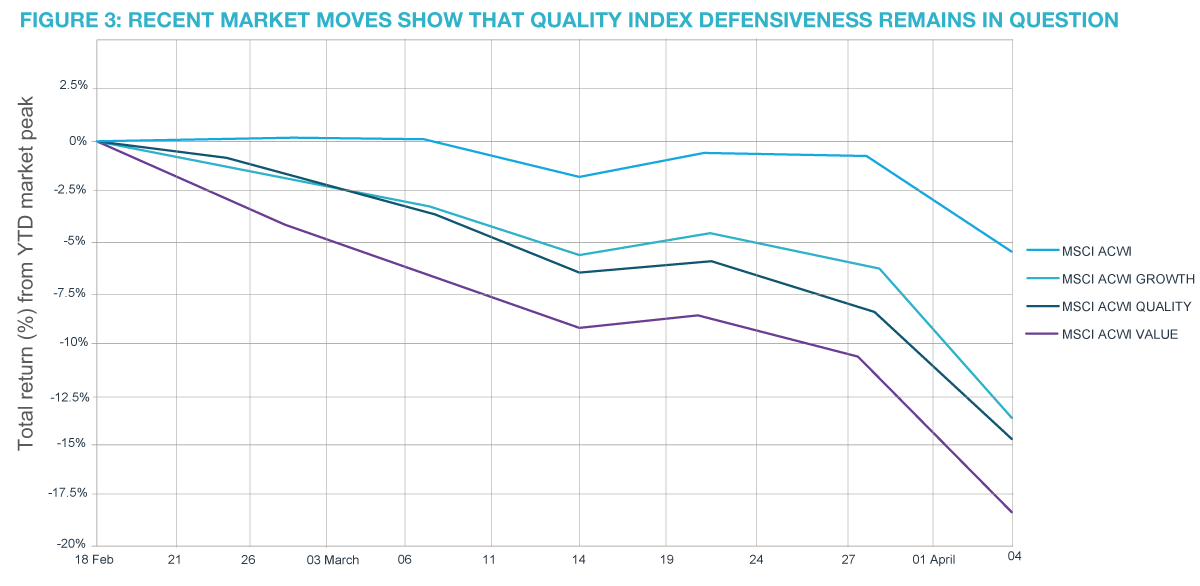
Sources: FE Fund Info 2025, bfinance. Returns shows in USD, index returns gross. Data from 18 February to 4 April 2025.
Understanding active quality manager performance
The diversity of approaches within the quality universe makes the discussion around benchmark selection still more complex. The heterogeneity is such that we at bfinance have had to answer with three distinct active manager peer groups for performance comparison: Classic Quality, Quality Value, and Quality Growth (see Defensive Equities and Market Downturns for more details). More straightforward, perhaps, to stick with the standard market benchmark as an appropriate yardstick, though adjusting expectations based on the nuance of each group.
Today, we might also (in an asset manager’s shoes) add another, even cruder objection to being measured against quality indices: trailing underperformance is more pronounced against the MSCI ACWI Quality than against the MSCI ACWI, using the median net return of active global equity strategies in bfinance’s quality peer groups. However, alpha from active quality managers remains attractive when taking a longer-term view against the mainstream MSCI ACWI benchmark.
In bfinance’s quality-oriented manager equity search reviews, managers continue to eschew quality indices for performance measurement as unsuitable. They also (reasonably) point to the risk and risk-adjusted return outcomes that investors should consider, beyond index relative performance metrics. As specified in Figure 3, we observe the desired downside capture < 100% and beta < 1.0 across most Quality peer groups, particularly over the long term – and whether measured against the MSCI ACWI or MSCI ACWI Quality.
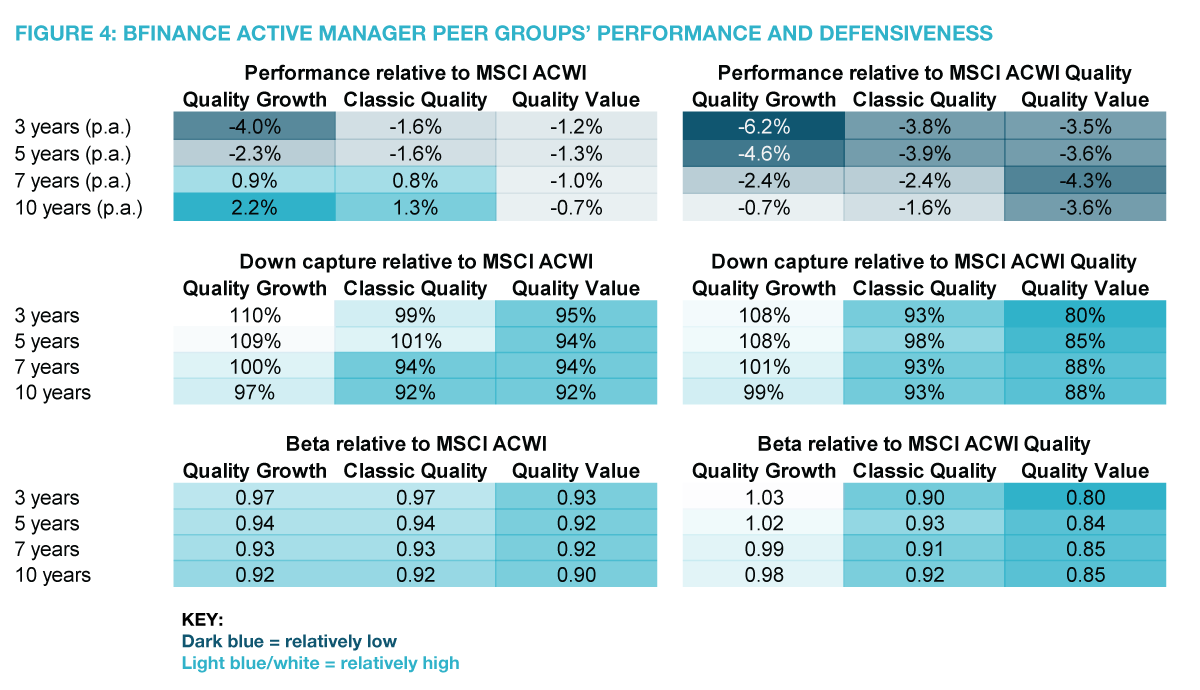
Sources: eVestment, bfinance. USD, index returns net. Data to 28 February 2025. Performance metrics are net of representative 55bps management fee (downcapture and beta metrics gross). bfinance style peer groups include a representative sample of strategies as a proxy for how managers of said style are performing. They do not represent recommendations.
Conclusion
The defensiveness of quality investing and its ability to provide a smoother return path over time have underpinned credibility and investor demand. Periods of volatility or market drawdowns only heighten this need. Yet, quality benchmarks do not seem an appropriate yardstick for the performance of defensive quality managers.
In the absence of a ‘perfect’ quality benchmark, investors can focus their scrutiny elsewhere. Evaluating a manager’s downside capture and performance during historical downturns against traditional main market indices (and taking into account the highly unusual nature of the 2020 and 2022 declines!) can provide insight into the ability of a strategy to deliver the hoped-for stability. Assessing performance and portfolio characteristics across periods of economic stress and different style regimes helps to determine whether a quality strategy can maintain its profile in varying conditions.
bfinance’s recent manager research in this space has provided interesting conclusions. For example, while there are weaker (and stronger) performers from a relative return standpoint, many active quality managers have in fact managed to deliver superior downside protection versus mainstream market cap indices, and produce more stable returns over the long-term time while keeping pace in rising markets. Resilience, not just returns, should remain central to quality investing – but cannot be assumed from a strategy (or benchmark) label.
Important Notices
This commentary is for institutional investors classified as Professional Clients as per FCA handbook rules COBS 3.5R. It does not constitute investment research, a financial promotion or a recommendation of any instrument, strategy or provider. The accuracy of information obtained from third parties has not been independently verified. Opinions not guarantees: the findings and opinions expressed herein are the intellectual property of bfinance and are subject to change; they are not intended to convey any guarantees as to the future performance of the investment products, asset classes, or capital markets discussed. The value of investments can go down as well as up.