 Français (France)
  Deutsch (DACH)
  Italiano (Italia)
  Dutch (Nederlands)
  English (United States)
  English (Canada)
  French (Canada)
bfinance insight from:

Martha Brindle
Director, Equities
Many investors and asset managers are now focused on achieving low carbon intensity. Yet analysis of portfolio ‘temperature’ shows that low intensity does not necessarily produce alignment with climate goals and—worse still—can mask the efforts needed to decarbonise companies in the real world.
The latest analysis from various sources shows there is still a long way to go across many sectors, industries and geographies if we are to limit global warming to internationally agreed goals. For instance, S&P TruCost data shows that every sector in the S&P 500 aside from financials is ‘over budget’ (i.e. not aligned) relative to a 1.5°C outcome, and that is before full consideration of Scope 3 emissions. There is much to be done.
Previous articles within this ‘Climate in Equities’ series have discussed the challenges involved in addressing carbon footprints and climate change within equity portfolios (‘Three Carbon-cutting Pitfalls’; ‘Carbon Cuts or Climate Impact?’). Many asset owners and investment managers are now taking positive steps to measure and manage their carbon footprint: carbon intensity is one of the more popular metrics, perhaps due to the relative simplicity of calculations. Yet there has been some backlash against ‘carbon tunnel vision’, as it is sometimes termed. Realised emissions are inherently backward-looking and do not provide the full picture.
There has been some backlash against ‘carbon tunnel vision’, as it is sometimes termed
As such, this third instalment takes a closer look at Implied Temperature Rise (ITR): a forward-looking measure that helps to indicate degree of alignment between investments and climate-related objectives over the coming decades. The article features proprietary data to illustrate how equity managers of different styles stack up against their peers from an ITR perspective. In addition, we compare these figures to carbon footprint metrics for the same active manager composites, illustrating the importance of considering both lenses (and others besides).
It is crucial that investors’ approaches to climate are sophisticated and nuanced – not overly simplistic and based on the delivery of a single metric.
Jargon buster:
- Implied Temperature Rise (ITR): This is calculated by comparing the financed carbon budget of portfolio holdings to the financed projected emissions. The resulting ‘temperature rise’ indicates how much the portfolio exceeds or falls below its carbon budget.
- Carbon intensity: A measure of carbon dioxide emissions relative to a unit of output. In an investment portfolio context, this is typically relative to dollar revenues. It can be expressed as a weighted average for a portfolio, a measure of exposure to carbon intensive companies.
- Financed carbon emissions: A normalised carbon footprint measure, relative to USD 1 million invested. It is calculated as the total Scope 1 + 2 carbon emissions weighted by portfolio enterprise value (including cash) and the weight of companies in the fund.
- Net zero: Balanced greenhouse gases emissions and removals that will limit global warming to 1.5 degrees before 2050, primarily (90%) by directly reducing emissions.
- Carbon neutral: Balanced greenhouse gases and emissions, including the use of carbon offsets or compensated emissions.
- Climate Value at Risk (VaR): Climate VaR quantifies the potential monetary loss that a company or portfolio could suffer due to climate risks and opportunities. Narrower climate VaR measures include transition risk VaR (focused on mitigation and decarbonisation), physical risk VaR (focused on adaptation) and technology.
Implied Temperature Rise data across equity styles
Before determining whether and how various portfolio climate metrics should be used in portfolio governance, it can be helpful to explore the current profile of active equity managers with respect to those metrics. Such analysis can help inform asset owners about investment approaches that are currently well positioned – or challenged – to meet climate transition goals and act as a potential yardstick when assessing peers.
Below, Figure 1 shows Implied Temperature Rise (ITR) data from bfinance’s global equity manager composites across ten styles. Each active manager composite contains a select number of managers that we consider representative of the specific style, irrespective of their product label. This data can help investors to understand how a ‘typical’ manager in the style might currently look with respect to ITR figures. After a look at the ITR data, Figure 2 shows median financed carbon emissions of the same active manager composites.
Figure 1: Median portfolio implied temperature rise of active equity manager composites
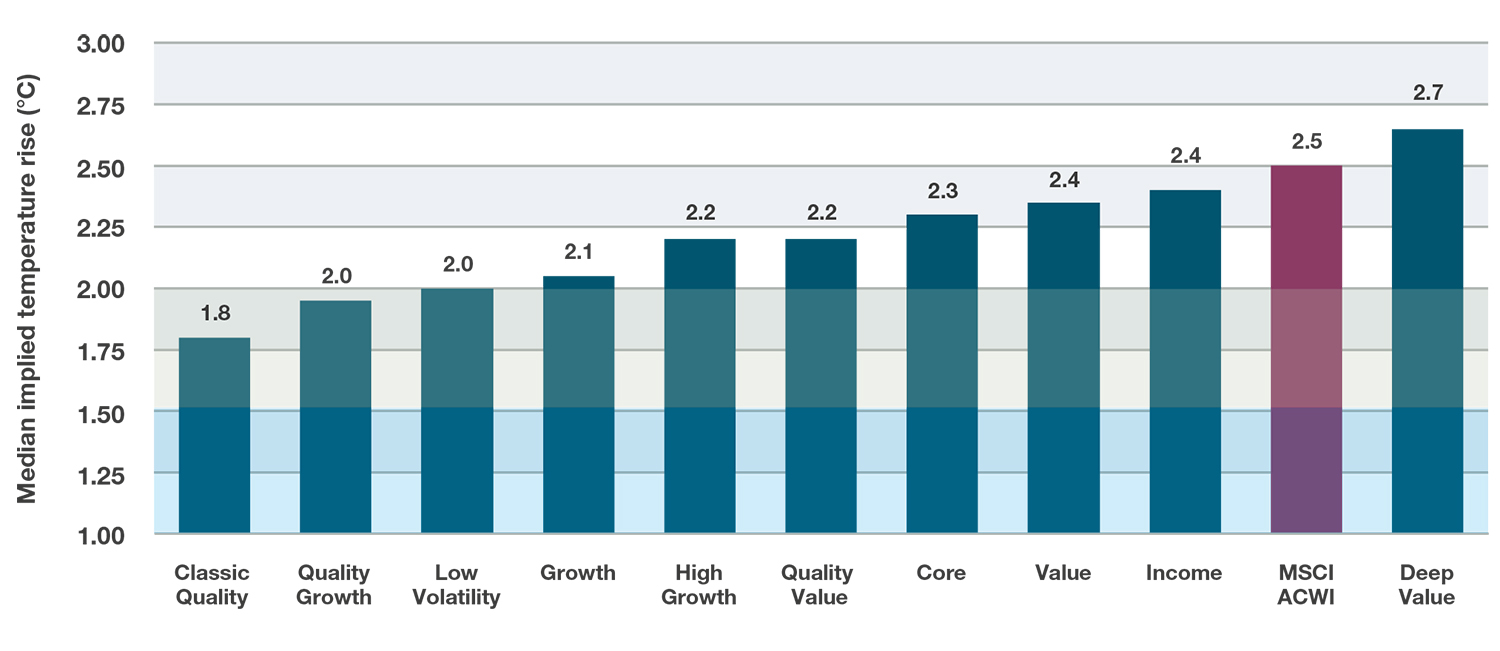
Source: bfinance, MSCI. Analysis uses MSCI ESG data at August 2023. The bfinance global equity style composites feature actively managed strategies that are representative of the named styles. The ITR shown is the median ITR of the asset managers in the relevant composite.
Calculating implied portfolio temperatures across ten global equity style groups reveals that the majority have a lower median ITR than the MSCI World (2.4°C) or MSCI ACWI (2.5°C). Quality and Growth leaning styles have a lower median temperature than more Value and Income leaning styles. This comes as no surprise given their typical sector exposures: the latter are more inclusive of Energy and Industrials (when valuation opportunities allow), as discussed earlier in this series. At an individual manager level, regional biases should also be considered: the inclusion of emerging markets or the weighting towards the US, for example, can meaningfully affect the ITR. Investors should remain mindful that the number of underlying companies in the index with climate targets for 1.5 degree alignment remains low (albeit growing from a small base), as discussed below Figure 3.
Importantly, there is a great deal of heterogeneity within many of these style groups – particularly in terms of ITR figures for Deep Value, Classic Quality and High Growth managers. Transition-minded investors should not be tempted to overlook a style that appears less attractive on this chart: it is entirely possible to find climate-aligned strategies within all categories. One also should not assume that all Classic Quality and Quality Growth managers may have a natural climate alignment ‘tailwind’ as a result of their typical structural biases and exposures. In addition, certain asset managers will have a less consistent ITR profile than others: many Deep Value managers, for example, look poor in this analysis but are heavily led by current opportunities in any part of the market, so their exposures and resulting ITR numbers can change a great deal over time.
It’s important to remember that active managers in these equity composites are generally not seeking to deliver a temperature alignment: the ITR number is a by-product of their current portfolio. Outside of dedicated climate or positive environmental impact strategies, it is still rare to find managers that are explicitly targeting a portfolio temperature; the adoption of Net Zero targets is still an evolving subject. Beyond style, investment process and construction will also matter: shifting a systematic strategy towards a lower temperature pathway will look very different from adapting a more concentrated, fundamental approach.
Looking at multiple metrics
As the Task Force on Climate-Related Financial Disclosures' (TCFD) Portfolio Alignment Team argued in a recent report (Measuring Portfolio Alignment), portfolio temperature targets should be used in addition to—rather than instead of—carbon reduction goals. The predictive nature of the Implied Temperature Rise metric is its strength but also its weakness. When we look at implied temperature rise alongside a variety of other climate or carbon-linked metrics, the importance of using multiple metrics becomes clearer. In Figure 2, we see the median financed carbon emissions of the same manager composites shown in Figure 1.
Figure 2: Median financed carbon emissions of active equity manager composites
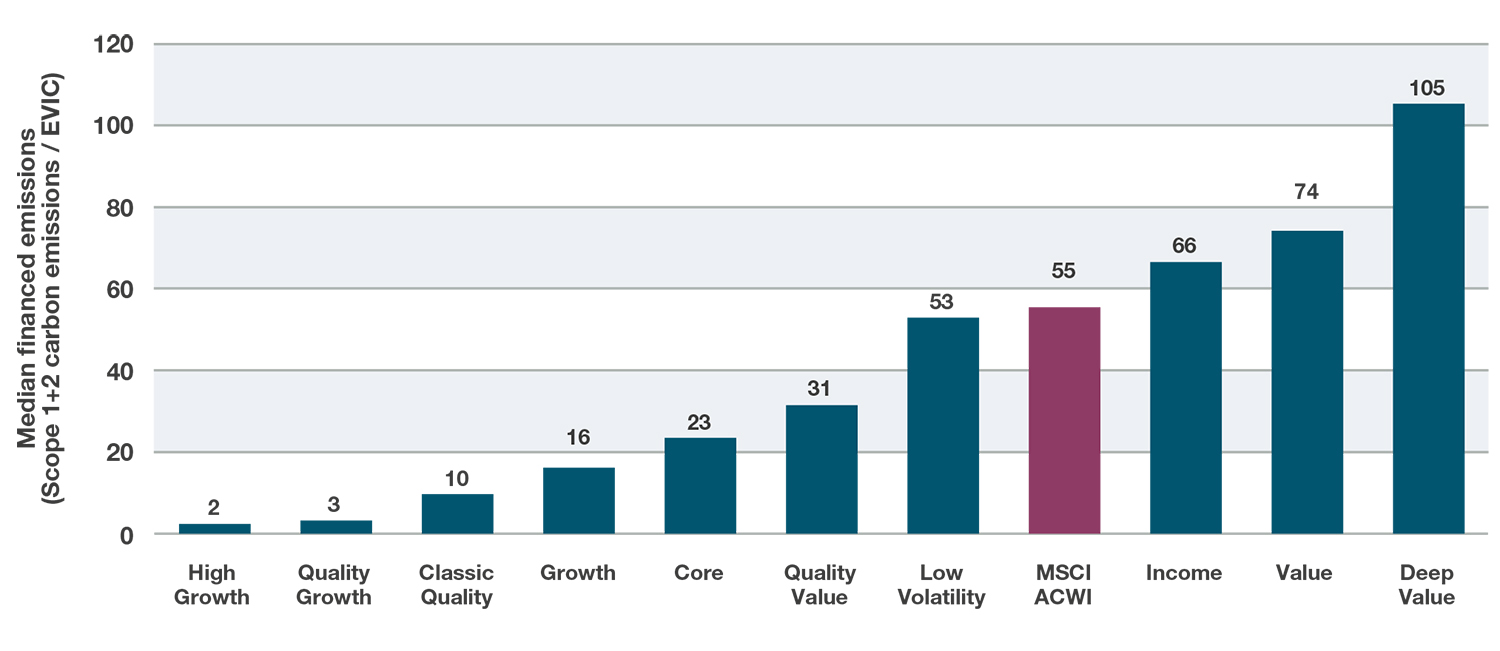
Source: bfinance, MSCI. Analysis uses MSCI ESG data at August 2023. The bfinance global equity style composites feature actively managed strategies that are representative of the named styles. The figure shown is the median figure of the asset managers in the relevant composite.
It is interesting to compare this data with the ITR figures shown previously, not least because the ordering of the composites has changed significantly. This point is reinforced by Figure 3, which shows the ITR and financed carbon emission data side by side. In addition, for an alternative viewpoint, this table also shows proportions of the portfolio invested in companies that are already aligned with either 2.0 or 1.5 degree temperature rises.
The colour scheme of Figure 3 allows for easy and intuitive identification of the styles at the ‘top’ and the ‘bottom’ of the rankings in each case.
Figure 3: Median position of manager style composites on four climate-related lenses
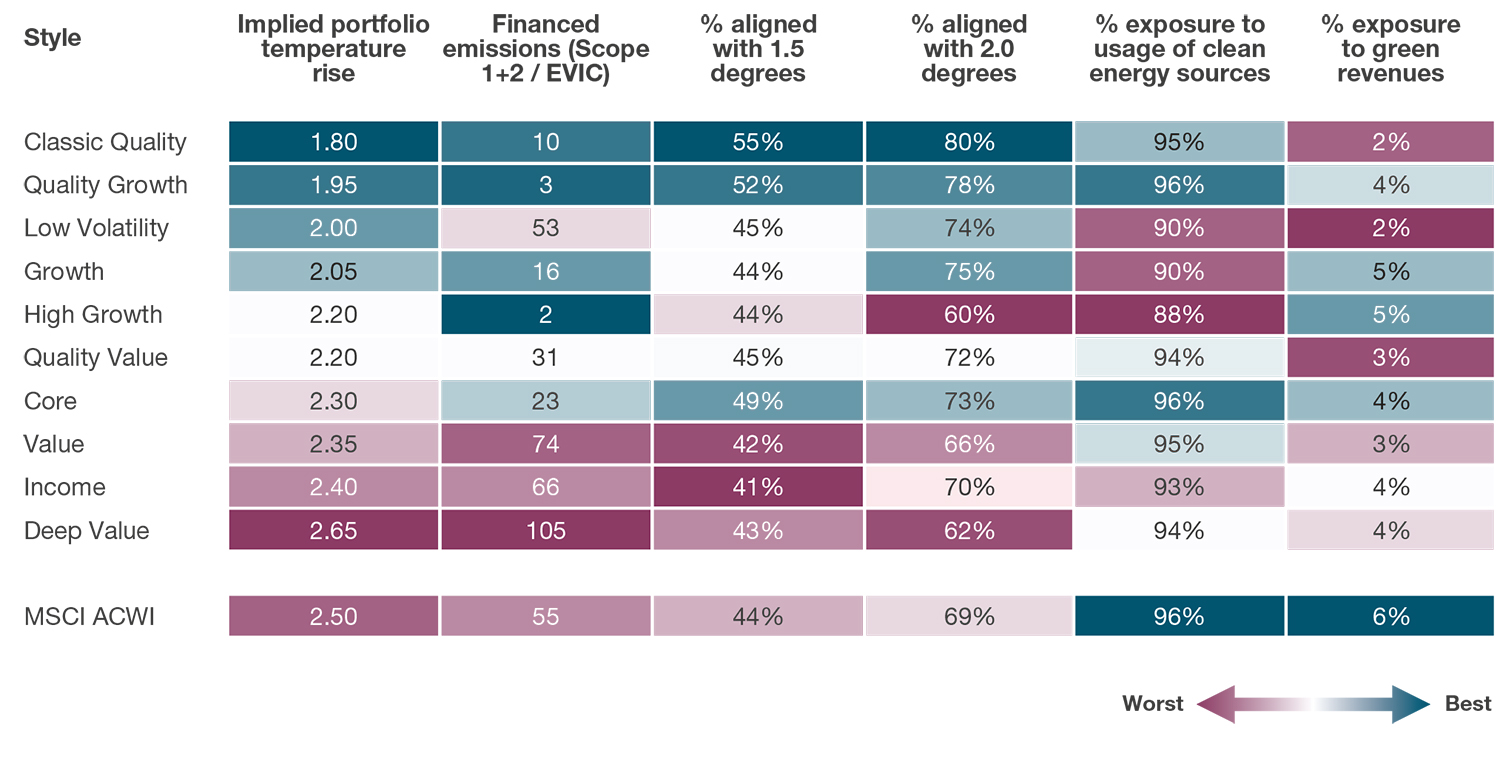
Source: bfinance, MSCI. Analysis uses MSCI ESG data at August 2023. The bfinance global equity style composites feature actively managed strategies that are representative of the named styles. Colour coded so that the ‘best’ in each category is blue and the ‘worst’ is purple, for ease of viewing.
Readers may be particularly interested to see differences in the placement of certain groups, such as the Low Volatility managers (among the weaker composites in terms of financed carbon emissions, but giving a relatively attractive median ITR of 2.0 degrees).
It’s also worth noting that, while 44% of the MSCI ACWI index (by weight) comprises companies with an implied temperature rise of ≤1.5°C, this figure is highly skewed by a small number of large firms (e.g. tech giants). If we look at the MSCI ACWI Investible Market Index, which includes thousands more constituents across small to large cap companies, only 22% by weight have an implied temperature rise of ≤1.5°C. As such, an investor currently looking to achieve 1.5°C alignment within well-diversified equity portfolios may find the task extremely challenging.
Five To-Dos for equity investors
As research continues to emerge, it is increasingly clear that investors should take a multi-faceted approach and avoid reliance on a single measure. Although investors face added pressure to take action—from regulators, industry bodies and underlying stakeholders—it is important that this pressure does not compromise investors’ ability and willingness to take a nuanced approach. Five key points to remember are:-
- Supplement, don’t replace: Portfolio temperature targets should be used in addition to (not instead of) other metrics. ITR is a helpful tool but is not a panacea. Seek a holistic approach that includes risk-oriented measures such as carbon VaR, and physical and transition risk exposure. ITR can be used to assess hotspots and identify areas for action and engagement.
- Watch out for data quality: Forward-looking estimates and forecasts are inherently inaccurate and climate data (like most ESG data) is subject to quality and coverage issues. Data can inform and guide asset owners on their managers’ climate positions, where to engage and how to understand potentially problematic outlier managers.
- Manage unintended investment consequences: Imposing strict portfolio targets or optimising portfolios based on single metrics such as temperature alignment for portfolio managers may result in unintended strategy shifts and risk/return outcomes as portfolios are adapted to achieve KPIs. Strict portfolio objectives may also limit the potential manager universe that is willing or able to meet such targets. Indeed, not all managers yet have the ability to report on all relevant metrics.
- Handle incentives with care: When seeking to implement temperature targets or KPIs, investors may wish to build in financial incentives for the asset managers but these must be approached with caution. Some studies find particular challenges around ‘ratcheting targets’ for laggards, which reflect the ramping up of many investors’ climate change commitments (from 2050 to 2030, 2°C to 1.5°C).
- Remember that the ‘real world’ is the priority: Real-world decarbonisation, not delivery of metrics, should be the focus of climate-minded investors. Investors should scrutinise managers’ actions to ensure that positive climate results can be achieved with real-world change. Positive hallmarks include using effective stewardship to increase the number of companies with science-based targets (SBTi), providing clear attribution for the reduction in carbon over time and engaging even with ‘emission-light’ companies (such as financials/banks whose high ‘Scope 3’ emissions risk falling below the radar and who may well be engaged in lending to highly non-aligned businesses).
Important Notices
This commentary is for institutional investors classified as Professional Clients as per FCA handbook rules COBS 3.5R. It does not constitute investment research, a financial promotion or a recommendation of any instrument, strategy or provider. The accuracy of information obtained from third parties has not been independently verified. Opinions not guarantees: the findings and opinions expressed herein are the intellectual property of bfinance and are subject to change; they are not intended to convey any guarantees as to the future performance of the investment products, asset classes, or capital markets discussed. The value of investments can go down as well as up.